最近在看性能UI performance testing 的工具
其中一个是 sitespeed。
sitespeed.io 是 一款可监视和衡量网站前端性能的开源工具。 1. 开 源 2 . 支持事务模 拟 3 . 自动性能分析,形成可视化报 告 4 . 提供的 docker 镜像已搭建完成监控系统,满足线上环境监控。它拥有一套插件,如 Coach 、 Broswertime 、 Chrome-HAR 等,帮助 sitespeed 搜集浏览器 debug状态下的数据,并基于网站最佳实践给出相应的打分和意见,最后把数据可视化展示。 sitespeed.io 评价网页的主要依据是:浏览器的网络请求和 TimeLine 中的 Time Event 。
然后可以结合graphite 和 grafana 做展示 以及性能监测。
我是基于docker来学习这个工具的, 容器它一般做好了一些配置,而且也会维护,还是挺好用的。使用的操作系统是win10
1. 先把sitespeedio 的 image 拉下来:docker pull sitespeedio/sitespeed.io
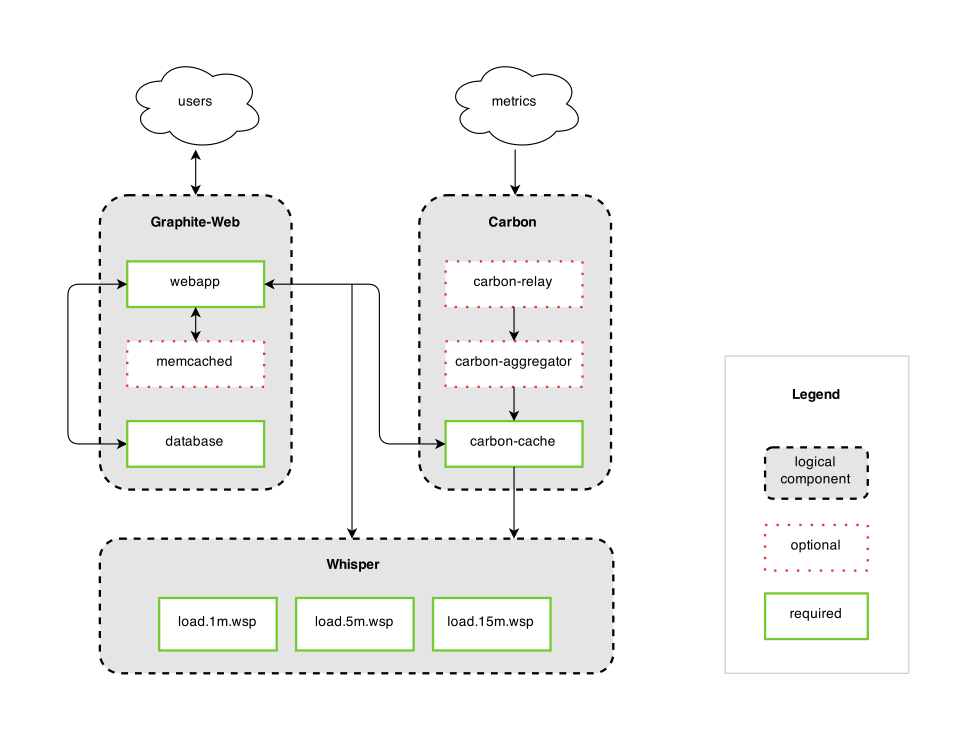
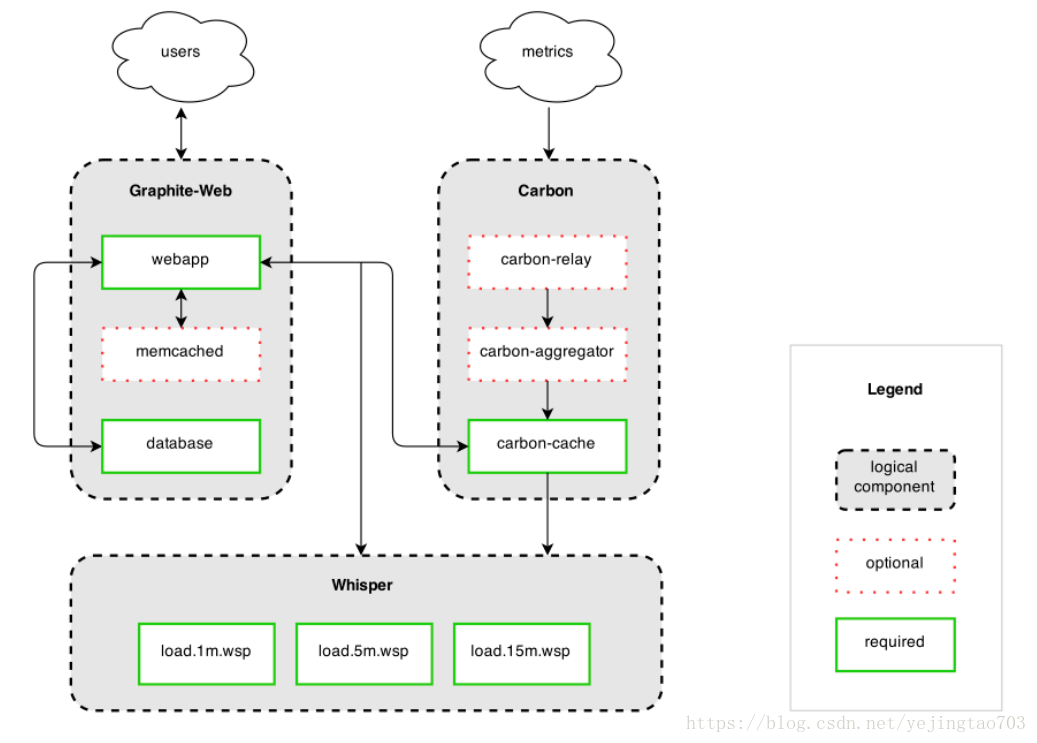
2. 然后把 docker compose 下载下来,这个compose是包含了 graphite+grafana 的配置和image 。
https://raw.githubusercontent.com/sitespeedio/sitespeed.io/main/docker/docker-compose.yml
3.切换到存放 docker-compose.yml 的folder,执行:
docker-compose up -d
4.运行命令获取数据。这里有个坑, 我一直以为--graphite.host 是指127.0.0.1:2003 , 结果是直接复制host.docker.internal 这个就行了
docker run --shm-size=1g --rm -v /d/cd:/sitespeed.io sitespeedio/sitespeed.io test.js --multi --network sitespeedio_default --graphite.host=host.docker.internal
docker run --shm-size=1g --rm -v /d/cd:/sitespeed.io sitespeedio/sitespeed.io test.js --multi --network sitespeedio_default --graphite.host=host.docker.internal
运行成功后数据已经保存起来了。

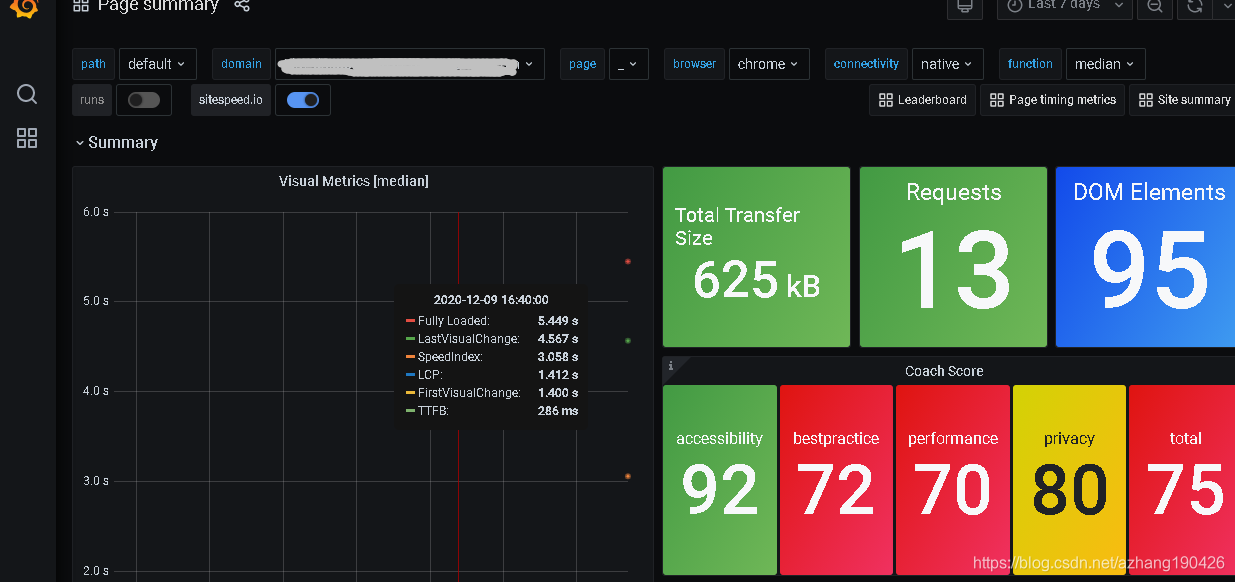
5.打开 grafana http://127.0.0.1:3000
就可以看到默认的数据了:
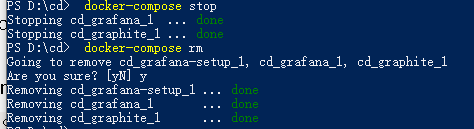
6. 测试结束后 记得关闭 和 移除 。docker-compose stop
如果执行了 docker-compose rm , 下次在运行要重新启动compose 执行:
docker-compose up -d , 来创建container
以上是初次接触的步骤,如果需要实际运用, 官网是建议:but if you want to run it in production, you should modify it by making sure that the metrics are stored outside of your container/volumes 。
compose 里面有给对应的写法:
volumes:
# In production you should configure/map these to your container
# Make sure whisper and graphite.db/grafana.db lives outside your containerr
# https://www.sitespeed.io/documentation/sitespeed.io/graphite/#graphite-for-production-important
- whisper:/opt/graphite/storage/whisper
# Download an empty graphite.db from https://github.com/sitespeedio/sitespeed.io/tree/main/docker/graphite
# - /absolute/path/to/graphite/graphite.db:/opt/graphite/storage/graphite.db
#
# And put the configuration files on your server, configure them as you need
# Download from https://github.com/sitespeedio/docker-graphite-statsd/tree/main/conf/graphite
# - /absolute/path/to/graphite/conf/storage-schemas.conf:/opt/graphite/conf/storage-schemas.conf
# - /absolute/path/to/graphite/conf/storage-aggregation.conf:/opt/graphite/conf/storage-aggregation.conf
# - /absolute/path/to/graphite/conf/carbon.conf:/opt/graphite/conf/carbon.conf
具体看这个: https://github.com/sitespeedio/docker-graphite-statsd/blob/main/README.md
然后默认的dashboad 各个部分的意思上面也有解说:
https://www.sitespeed.io/documentation/sitespeed.io/performance-dashboard/#up-and-running-in-almost-5-minutes
如果graphite是部署在其他机子上 可以配置host为实际的地址Configure
--graphite.host = 125.255.24.1
接下来有时间可以整理一下 sitespeed 和 Lighthouse 的使用


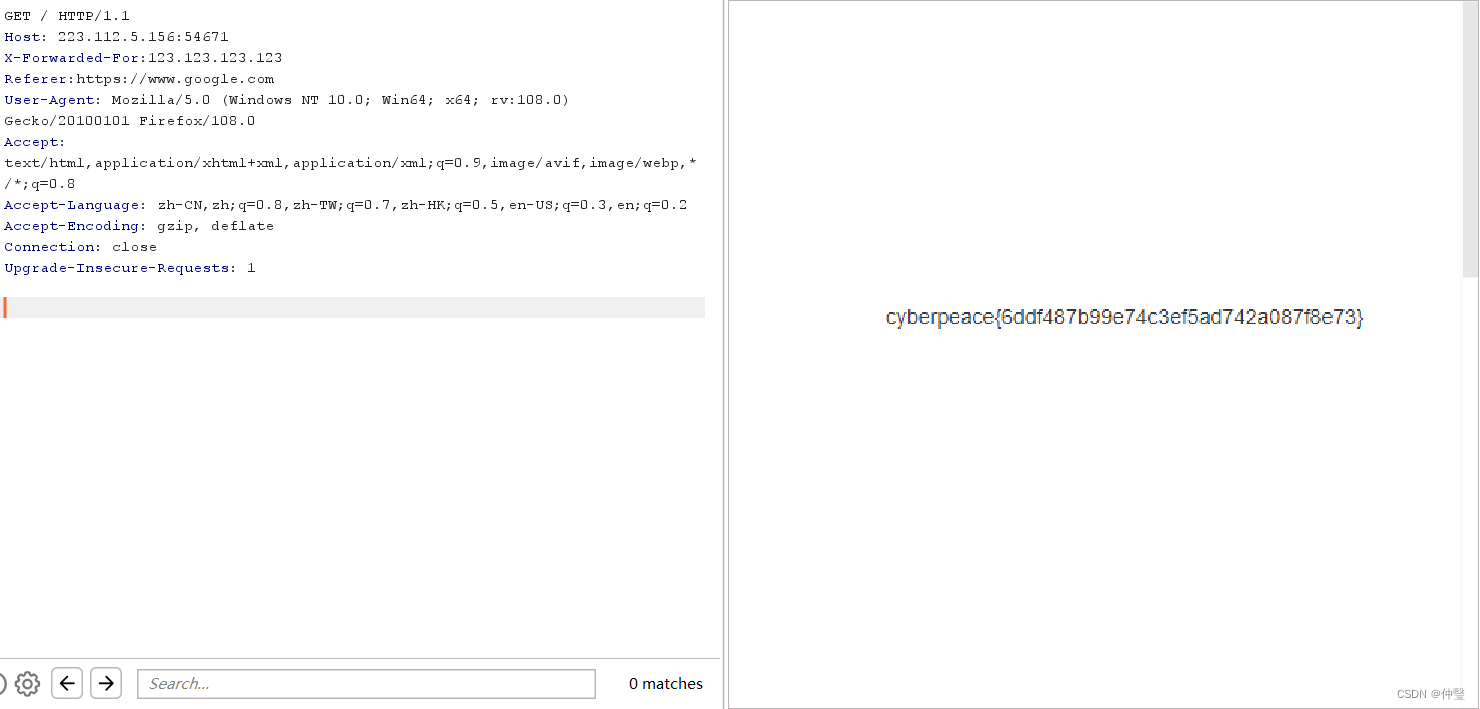

![[CTF/网络安全] 攻防世界 xff_referer 解题详析](https://img-blog.csdnimg.cn/11f390c5dd2c45fda42155833b78bd99.png#pic_center)