爱彼迎官网:

1、业务背景与分析目的
Airbnb是一款短租产品,作为旅行者和房东之间的媒介颠覆了酒店行业。目前,Aribnb作为短租产品的头部品牌,业务涉及到190+个国家的34,000+ 个城市。
在Airbnb发展如此迅速的同时,是否可以从数据中发现业务存在的问题?
目的:探索数据集,发现数据规律和异常数据,提出改进建议指导业务发展。
定义问题: 1、价格区间是否合理
2、Airbnb的用户画像
3、通过评论数据集查看Airbnb流量渠道情况
4、数据的分析与预测
数据源:https://www.kaggle.com/dgomonov/new-york-city-airbnb-open-data
2、calendar数据集分析(价格情况等)
import pandas as pd
import numpy as np
import matplotlib.pyplot as plt
import seaborn as snscalendar = read_csv("./data/calendar.csv")
calendar.head()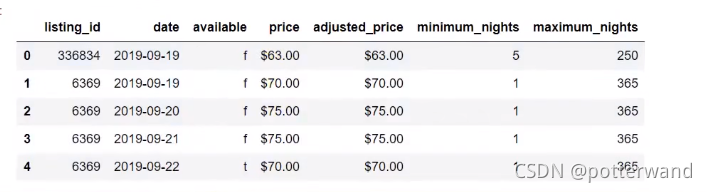
去掉数据中的&和,符号,并将日期从字符串类型转化为日期类型:
calendar['Price'] = calendar['Price'].str.replace(r"[$,]","",regex=True).astype(np.float32)
calendar['adjusted_price'] = calendar['adjusted_price'].str.replace(r"[$,]","",regex = True).astype(np.float32)
calendar['date'] = pd.to_datetime(['date'])
calendar['date'].head()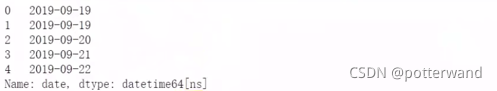
添加星期和月的列:
calendar['weekday'] = calendar['date'].dt.weekday
calendar['month'] = calendar['date'].dt.month
根据月份将价格进行分组并求出平均值,绘出柱状图:
month_price = calendar.groupby('month')['price'].mean()
sns.barplot(month_price.index,month_price.values) 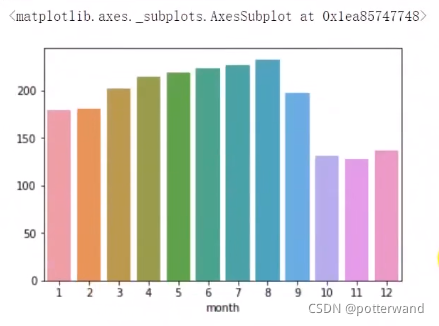
绘制价格小于300的直方图:
sns.barplot(calendar[calendar['price']<300]['price']) 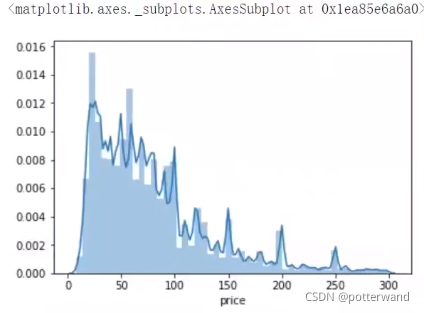
3、listings数据集分析(房子情况)
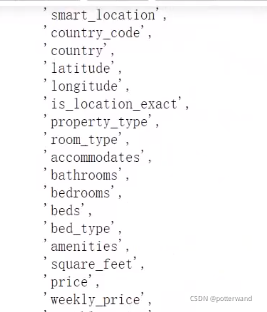
将列转化成列表来查看所有数据情况:
listings = read_csv("./data/listings.csv")
listings.columns.values。tolist() 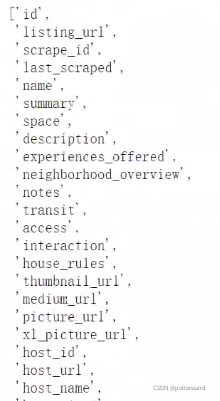
去掉数据中的&和,符号,并将小费中的空值替换为0:
listings['Price'] = listings['Price'].str.replace(r"[$,]","",regex=True).astype(np.float32)
listings['cleaning_fee'] = listings['cleaning_fee'].str.replace(r"[$,]","",regex=True).astype(np.float32)
listings['cleaning_fee'].fillna(0,inplace = True)
添加新字段,最低消费:
listings['minimum_cost'] = (listings['Price'] + listings['cleaning_fee'])*listings['minimum_nights']
listings['minimum_nights'].head() 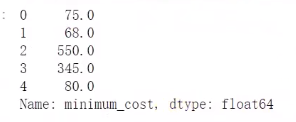
设施数量:
listings['n_amenities'] = listings['amenities'].str[-1:1].str.split(",").apply(len)
根据可容纳的人数,添加一个新的列,用来表示类型:Single(1),Couple(2),Family(5),Group(100)
listings['accommodates_type'] = pd.cut(listings['accommodates'],bins=[1,2,3,5,100],include_lowest=True,right=False,labels='Single','Couple','Family','Group')
listings['accommodates_type']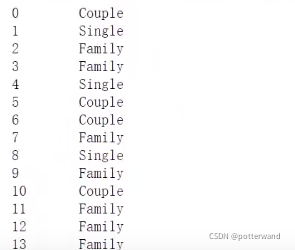
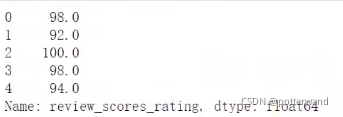
房子所在区域与评分:
listings['neighbourhood_group_cleansed'].head()
listings['review_scores_rating'].head()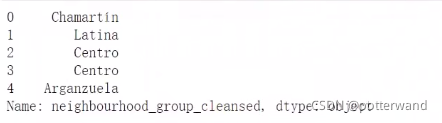
并先取出需要的数据: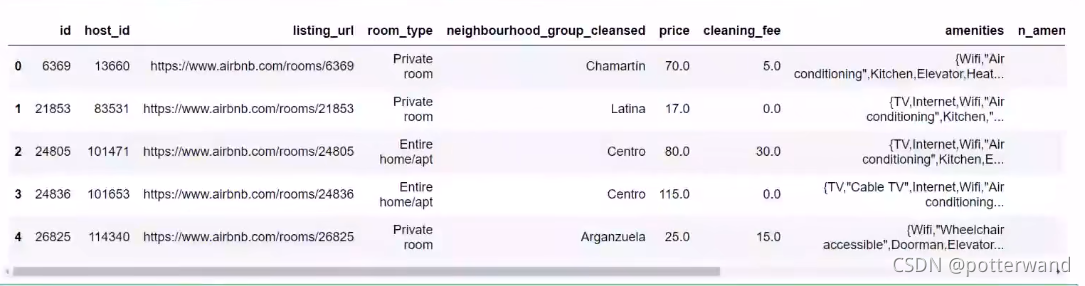
查看房间类型的情况,并绘制出饼图和柱状图:
room_type_counts=listings['room_type'].value_counts()
fig,axes=plt.subplots(1,2,figsize=(10,5))
axes[0].pie(room_type_counts.values,autopct="%.2f%%",labels=room_type_counts.index)
sns.barplot(room_type_counts.index,room_type_counts.values)
plt.tight_layout()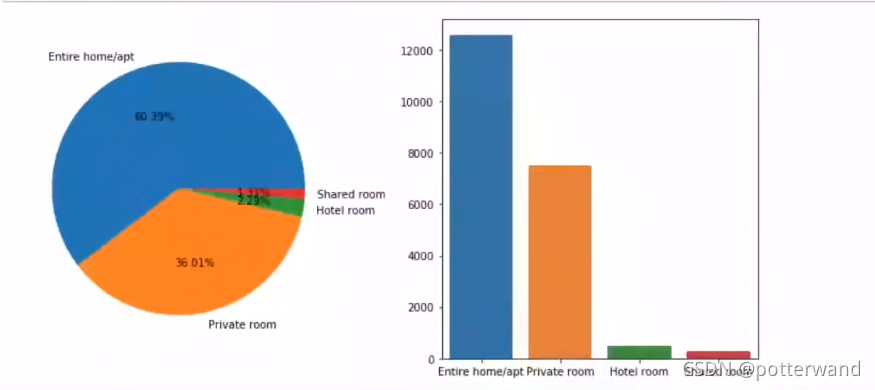
房子类型数量的条形图:
neighbourhood_counts = lingtings['neighbourhood_group_cleansed'].values_counts()
sns.barplot(y = neighbourhood_counts.index,x = neighbourhood_counts.values,orient = 'h') 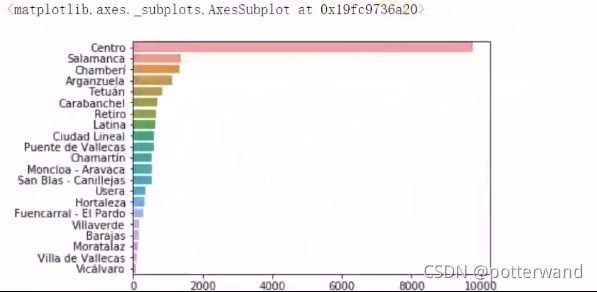
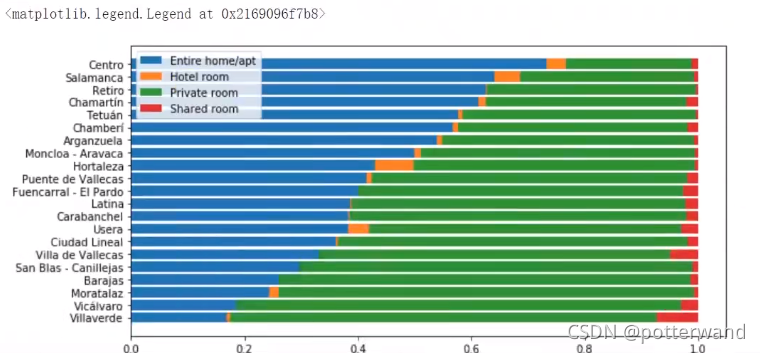
将数据分组并进行进一步的处理,去掉空值,并按行求出所对应的比例,并按第一列数据进行从大到小的排序:
neighbour_room _type = listings.groupby['neighbourhood_group_cleansed','room_type'].size() \
.unstack('room_type').fillna(0) \
.apply(lambda row:row/row.sum(),axis=1) \
.sort_values('Entire home/apt',ascending = False)
neighbour_room _type 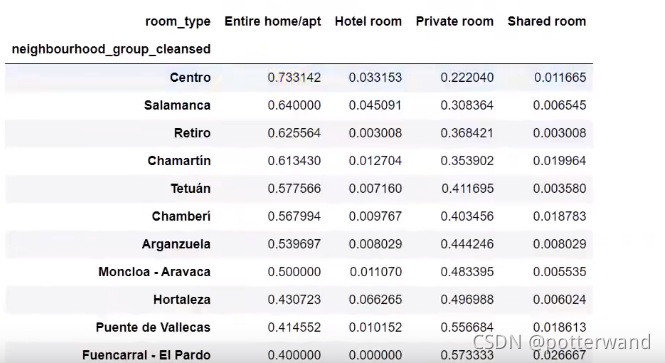
绘制出比例条形图:
columns = neighbour_room _type.columns
plt.figure(figsize=(10,5))
index = neighbour_room _type.index
plt.barh(index,columns=neighbour_room _type[columns[0]])
left = neighbour_room _type[columns[0]].copy()
plt.barh(index,columns=neighbour_room _type[columns[1]],left=left)
left += neighbour_room _type[columns[1]].copy()
plt.barh(index,columns=neighbour_room _type[columns[2]],left=left)
left += neighbour_room _type[columns[2]].copy()
plt.barh(index,columns=neighbour_room _type[columns[3]],left=left)
plt.legend(columns)
房东房源数量分析
可以看出大多房东都只有一套房子,少部分有两套,超过两套的都很少
host_number = listings.groupby('host_id')
sns.distplot(hostnumber[host_number<10]) 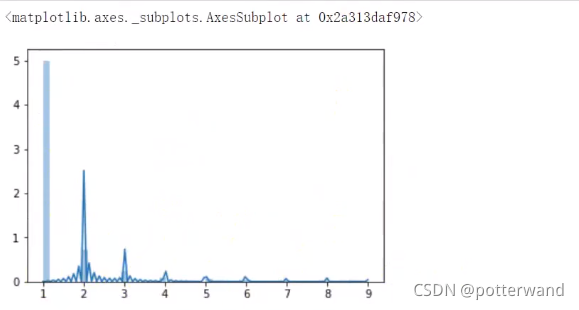
host_number_bins = pd.cut(host_number,bins=[1,2,3,5,100],include_lowest=True,right=False, \
labels=['1','2','3-4','5+']).value_counts()
plt.pie(host_number_bins,autopct="%.2f%%",labels=host_number_bins.index) 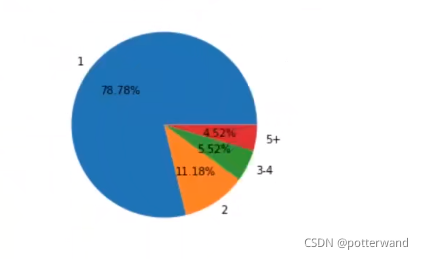
4、评论数据集分析
reviews = pd.read_csv("./data/reviews_detals.csv",parse_dates=['date'])
reviews.head()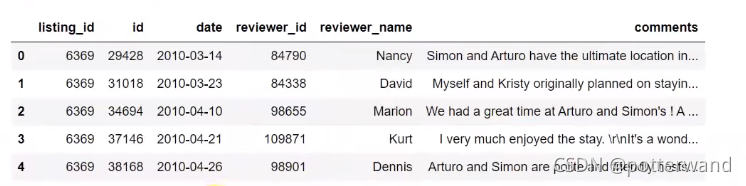
增加年和月两列,根据年和月分别进行分组,计算出每一年,每一月的评论数量,并绘制出柱状图(2019年10月-12月无数据):
reviews['year'] = reviews['date'].dt.year
reviews['month'] = reviews['date'].dt.monthn_reviews_year = reviews.groupby('year').size()
sns.barplot(n_reviews_year.index,n_reviews_year.values)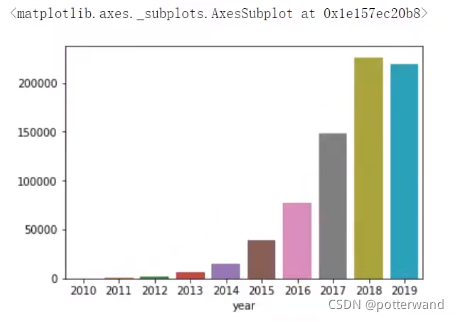
n_reviews_month = reviews.groupby('month').size()
sns.barplot(n_reviews_month.index,n_reviews_month.values) 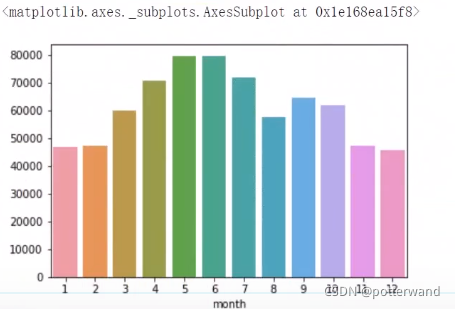
由上面价格图知道每年五六月份为销售价格增长期,也即销售增长期,所以评论数量也会随之增长,从上图中也能表现出来
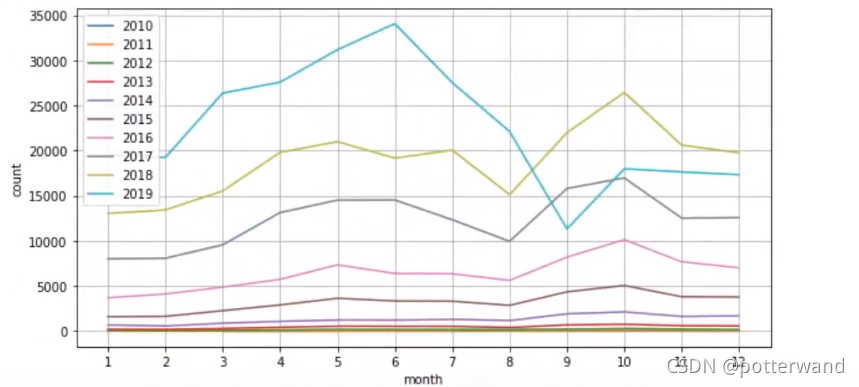
将两组数据进行汇总,并绘制出折线图:
year_month_reviews = reviews.groupby(['year','month']).unstack('month').fillna(0)
year_month_reviews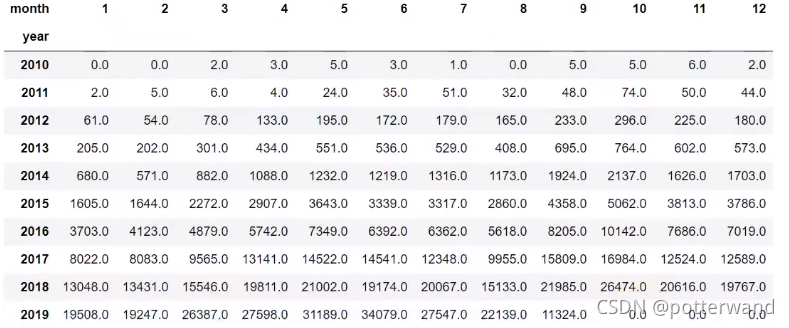
fig,ax = plt.subplots(figsize=(10,5))
for index in year_month_reviews.index:series=year_month_reviews.loc[index]sns.lineplot(x=series.index,y=series.values,ax=ax)
ax.legend(labels=year_month_reviews.index)
ax.grid()
pic=ax.set_xsticks(list(range(1,13)))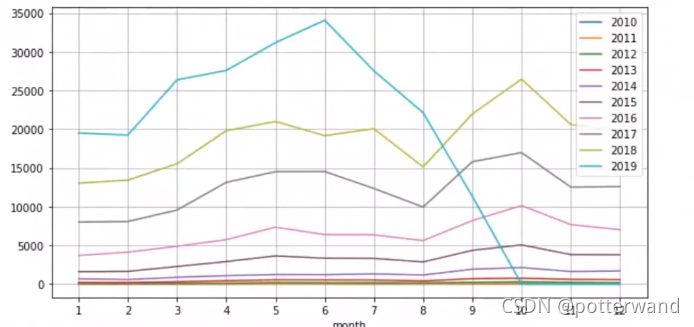
之后可根据公司业务对上述图形进行分析,如2017-2018年评论数量增幅巨大,可能公司在这两年间做出了一些业务调整或业务拓展等等。
5、预测房间价格
导入相关模块
from sklearn.preprocessing import StandardScaler对价格有影响的字段:
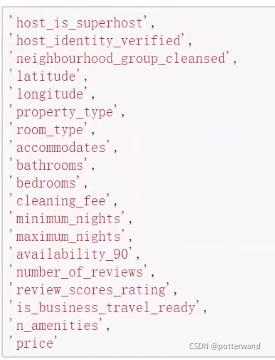
查看这些字段的详细信息:
ml_listings = listings_detailed[listings['price']<300][['host_is_superhost','host_identity_verified','neighbour_group_cleansed','property_type','room_type','is_business_travel_ready']
disperse_features=features[disperse_columns]]
ml_listings.info() 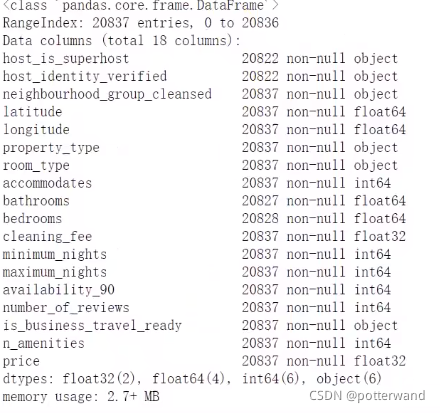
删除异常值,分割特征值和目标值:
ml_listings.dropna(axis=0,inplace=True)features=ml_listings.drop(columns=['price'])
targets=ml_listings['price']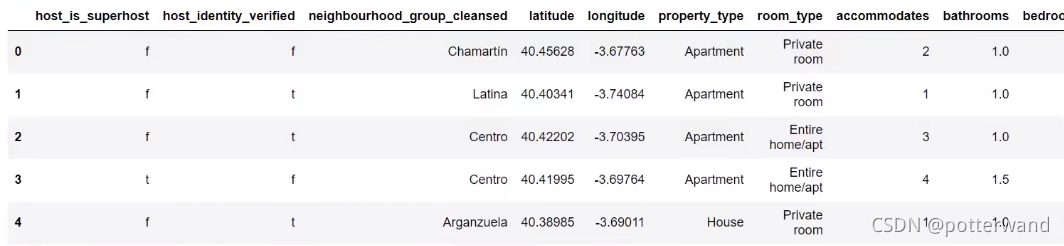
针对其中的离散型数据进行one-hot编码:
disperse_columns=['host_is_superhost','host_identity_verified','neighbour_group_cleansed','property_type','room_type','is_business_travel_ready']
disperse_features=features[disperse_columns]disperse_feature=pd.get_dummies(disperse_features)
disperse_feature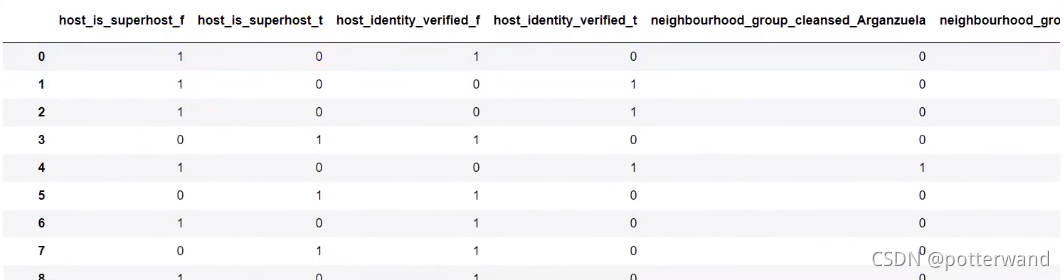
对连续型数据进行标准化(因为特征值之间相差不是很大,所以标准化可能对预测的结果影响不是很大):
continuous_features=features.drop(columns=disperse_columns)
scaler=StandardScaler()
continuous_features=scaler.fit_transform(continuous_features)
对处理后的特征横向进行组合:
feature_array=np.hstack([disperse_features,continuous_features])构建训练模型,并进行预测:
from sklearn.model_selection import train_test_split
from sklearn.linear_model import LinearRegression
from sklearn.metrics import mean_absolute_error,r2_scoreX_train,X_test,y_train,y_test=train_test_split(feature_array,targets,test_size=0.25)
regressor=LinearRegression()
regressor.fit_transform(X_train,y_train)
y_predict=regressor.predict(X_test)print("平均误差:",mean_absolute_error(y_test,y_predict))
print("R2评分:",r2_score(y_test,y_predict))![]()
模型准确度不太好,使用随机森林进行预测:
from sklearn.ensemble import RandomForestRegressorX_train,X_test,y_train,y_test=train_test_split(feature_array,targets,test_size=0.25)
regressor=RandomForestRegressor()
regressor.fit_transform(X_train,y_train)
y_predict=regressor.predict(X_test)print("平均误差:",mean_absolute_error(y_test,y_predict))
print("R2评分:",r2_score(y_test,y_predict))
6、评论数量预测
reviews.head()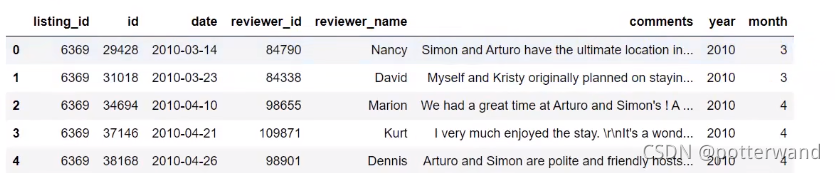
ym_reviews=reviews.groupby(['year','month']).size().reset_index().rename(coiumns={0:'count'})
ym_reviews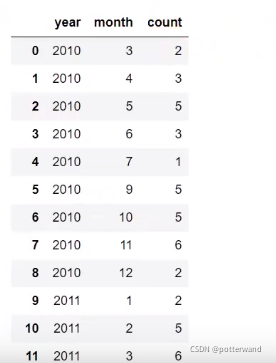
构建模型,使用随机森林进行预测,并查看准确率:
features=ym_reviews[['year','month']]
targets=ym_reviews['count']X_train,X_test,y_train,y_test=train_test_split(feature_array,targets,test_size=0.25)
regressor=RandomForestRegressor(n_estimators=100)
regressor.fit(X_train,y_train)
y_predict=regressor.predict(X_test)print("平均误差:",mean_absolute_error(y_test,y_predict))
print("R2评分:",r2_score(y_test,y_predict))![]()
由结果可看出模型预测准确率较好,因此对2019年10月,11月和12月的数据进行预测:
features=ym_reviews[['year','month']]
targets=ym_reviews['count']regressor=RandomForestRegressor(n_estimators=100)
regressor.fit(features,targets)y_predict=regressor.predict([2019,10],[2019,11],[2019,12])
y_predict
预测后结果为:
![]()
将预测值转换为DataFrame类型,并将预测值和源数据进行堆叠拼接,然后绘制出折线图:
predict_reviews=pd.DataFrame([[2019,10+index,x] for index,x in enumerate(y_predict)],columns=['year','month','count'])
final_reviews=pd.concat([ym_reviews,predict_reviews]).reset_index()years=final_reviews['year'].unique()
fig,ax = plt.subplots(figsize=(10,5))
for year in years:df=final_reviews[final_reviews['year']==year]sns.lineplot(x='month',y='count',data=df)ax.legend(labels=year_month_reviews.index)
ax.grid()
pic=ax.set_xsticks(list(range(1,13)))