摘要:主要讲解一些基本的信息传播模型,以及IC模型、SI模型和SIR模型的python实现及可视化。
- 2021.10.06更新
- 有需要的可以点击传送门
- 2020.09.26更新
- 更新了SIR模型的实现,请点击传送门,就不放在这篇博客里了
- 2020.09.03更新
- 更新了SI模型和IC模型用不同颜色表示每次激活的节点,在本文最后
author:xiao黄
缓慢而坚定的生长
信息传播模型
影响力模型
- IC模型
- LT模型
传染模型
- SI模型
- SIR模型
- SIS模型
- SIRS模型
Influence Models
- 影响模型可模拟用户如何影响网络中的每个人
- 节点有两个状态
未激活:节点未收到信息
激活:节点收到信息并且能够传播给他们的邻居
Independent Cascade (IC) Model
- 在 t 时刻被激活的节点在 t+1 时刻仅有一次机会去激活其邻居
- 假设节点 v 在 t 时刻被激活,对于 v 的任何邻居 w ,w 在 t+1 时刻被激活的概率是 P v w Pvw Pvw
- 如果是无权重的话,可以都设置为0.5,那么这样传播与不传播的概率就是一半一半了

例子
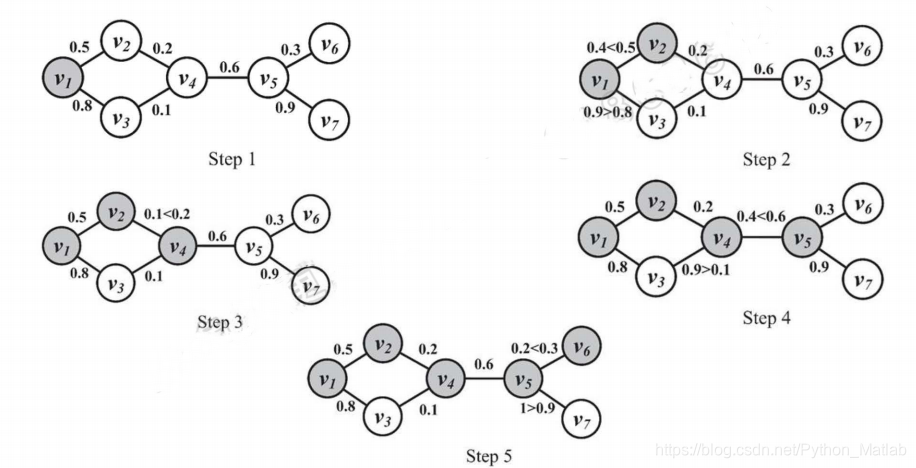
Liner Threshold (LT) Model
- 在任意时刻,激活的点都可以影响未被激活的点
- 每个节点都有激活阈值
- 如果影响程度超过该节点的阈值,则这节点被激活
Infection Models
- 传染模型也叫流行病模型,用于描述个人传播传染病的方式
- 节点有两种状态
易感人群:易感节点可能会感染疾病
感染人群:感染节点有机会去感染易感人群
免疫人群:感染节点被治愈后不会再得疾病的人群
Susceptible Infected (SI) Model
- 节点有两个状态
易感节点(S)
感染节点(I) - 如何传染
一个节点被感染,它将持续传染周围的节点
在每个离散时间中,每个被感染的节点尝试以概率p去感染它的易感(未感染)邻居

Susceptible Infected Recovered (SIR) Model
- Intuition:一些被感染的节点以一定的概率成为免疫节点,免疫节点不能被感染疾病或者传播疾病
- 节点有三种状态:
易感节点;感染节点;免疫节点 - 节点的变化

β:易感节点被成功感染的概率
γ:感染节点被治愈的概率
Susceptible Infected Susceptible (SIS) Model
- Intuition:感染节点以一定的概率变成易感节点,又有一定的概率被感染成感染节点
- 节点有两种状态
易感节点;感染节点 - 节点的变化

β:易感节点被成功感染的概率
γ:感染节点被治愈成易感节点的概率
Susceptible Infected Recovered Susceptible (SIRS) Model
- Intuition:免疫节点有一定的概率变成易感节点
- 节点的变化

β:易感节点被成功感染的概率
γ:感染节点被治愈成免疫节点的概率
λ:免疫节点有一定的概率转化成易感节点
IC模型的python实现
先上代码,这里我就不解释了,代码里面的注释我觉得很详细了,不懂可以评论或者私信。
import randomimport matplotlib.pyplot as plt
import networkx as nx
import numpy as npmax_iter_num = 10 # 模拟的次数
G = nx.karate_club_graph() # 空手道俱乐部for edge in G.edges:G.add_edge(edge[0], edge[1], weight=random.uniform(0,1)) # 可不可以作为权值
for node in G:G.add_node(node, state = 0) # 用state标识状态 state=0 未激活,state=1 激活seed = 33 # 选定33作为初始激活节点
G.node[seed]['state'] = 1 # 表示33被激活activated_graph = nx.Graph() # 被激活的图
activated_graph.add_node(seed)all_active_nodes = [] # 所有被激活的节点放在这里
all_active_nodes.append(seed)start_influence_nodes = [] # 刚被激活的节点 即有影响力去影响别人的节点
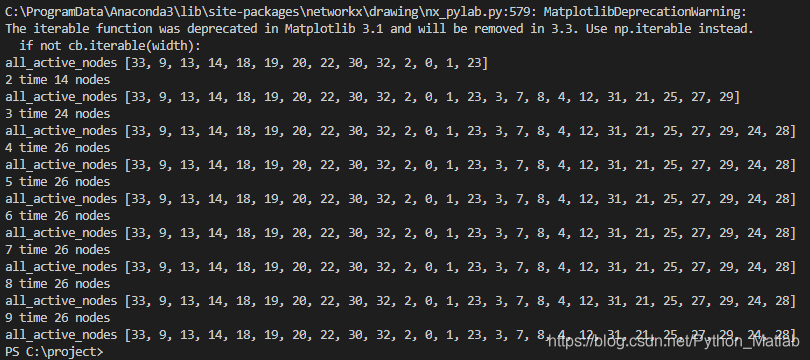
start_influence_nodes.append(seed)for i in range(max_iter_num):new_active = list()t1 = '%s time' % i + ' %s nodes' % len(all_active_nodes)print(t1) # 当前有多少个节点激活# 画图plt.title(t1)nx.draw(activated_graph, with_labels=True)plt.show()for v in start_influence_nodes:for nbr in G.neighbors(v): if G.node[nbr]['state'] == 0: # 如果这个邻居没被激活edge_data = G.get_edge_data(v, nbr)if random.uniform(0, 1) < edge_data['weight']:G.node[nbr]['state'] = 1new_active.append(nbr)activated_graph.add_edge(v, nbr) # 画图 添加边start_influence_nodes.clear() # 将原先的有个影响力的清空start_influence_nodes.extend(new_active) # 将新被激活的节点添加到有影响力all_active_nodes.extend(new_active) # 将新被激活的节点添加到激活的列表中print('all_active_nodes',all_active_nodes) # 打印
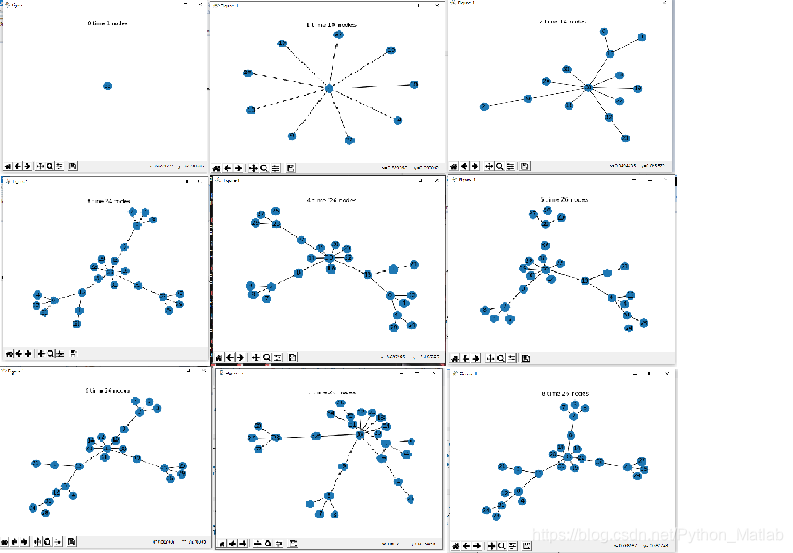
程序运行结果图:
节点图,这里我就放了9张,第十张不放了,你们运行的时候会看到的
SI模型的python实现
先上代码,这里我就不解释了,代码里面的注释我觉得很详细了,不懂可以评论或者私信。
import randomimport matplotlib.pyplot as plt
import networkx as nx
import numpy as npmax_iter_num = 5 # 模拟的次数
G = nx.karate_club_graph() # 空手道俱乐部for edge in G.edges:G.add_edge(edge[0], edge[1], weight=random.uniform(0,1)) # 可不可以作为权值 病毒的感染能力
for node in G:G.add_node(node, state = 0) # 用state标识状态 state=0 未激活,state=1 激活seed = 33 # 选定33作为传染源
G.node[seed]['state'] = 1 # 表示33是感染的all_infect_nodes = [] # 所有被感染的节点放在这里
all_infect_nodes.append(seed)infected_graph = nx.Graph() # 被激活的图
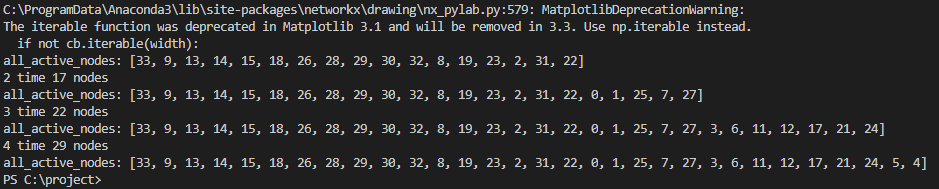
infected_graph.add_node(seed)for i in range(max_iter_num):new_infect = list() # 新被感染的t1 = '%s time' % i + ' %s nodes' % len(all_infect_nodes)print(t1) # 当前有多少个节点被感染# 画图plt.title(t1)nx.draw(infected_graph, with_labels=True)plt.show()# 感染的机会不止一次for v in all_infect_nodes:for nbr in G.neighbors(v):if G.node[nbr]['state'] == 0: # 如果这个邻居节点没被感染edge_data = G.get_edge_data(v, nbr)if random.uniform(0, 1) < edge_data['weight']:G.node[nbr]['state'] = 1new_infect.append(nbr)infected_graph.add_edge(v, nbr) # 画图 添加边all_infect_nodes.extend(new_infect) # 将新感染的添加到print('all_active_nodes:', all_infect_nodes)
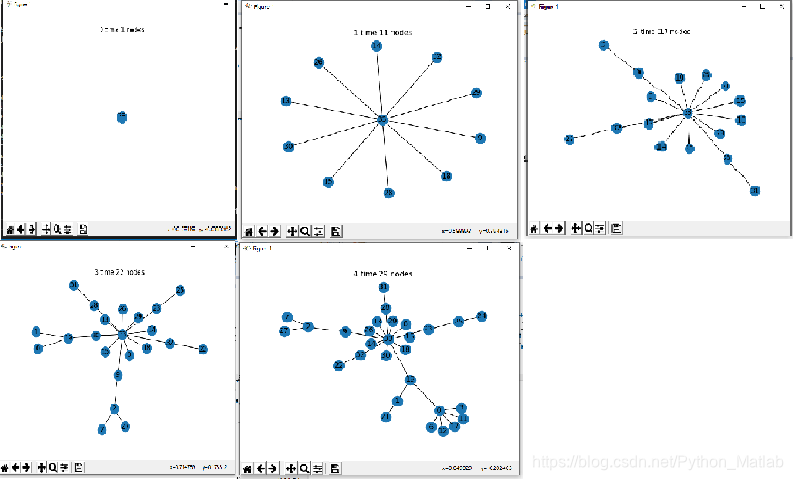
运行结果:
节点效果图:
IC模型的python实现更新版(2020.09.03)
import randomimport matplotlib.pyplot as plt
import networkx as nx
import numpy as npmax_iter_num = 10 # 模拟的次数
G = nx.karate_club_graph() # 空手道俱乐部for edge in G.edges:G.add_edge(edge[0], edge[1], weight=random.uniform(0,1)) # 可不可以作为权值
for node in G:G.add_node(node, state = 0) # 用state标识状态 state=0 未激活,state=1 激活seed = 33 # 选定33作为初始激活节点
G.node[seed]['state'] = 1 # 表示33被激活# activated_graph = nx.Graph() # 被激活的图
# activated_graph.add_node(seed)all_active_nodes = [] # 所有被激活的节点放在这里
all_active_nodes.append(seed)start_influence_nodes = [] # 刚被激活的节点 即有影响力去影响别人的节点
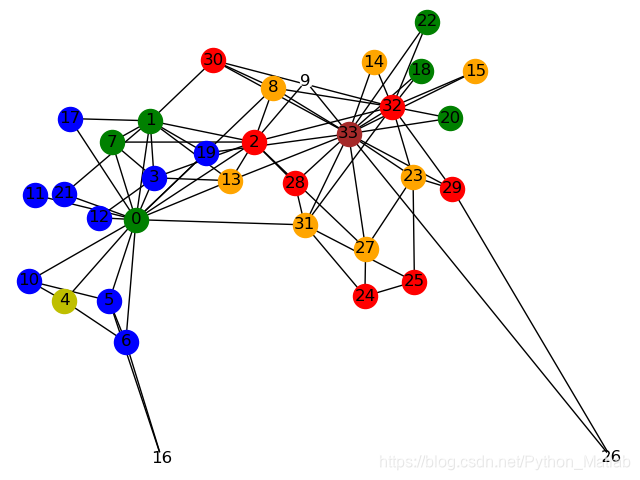
start_influence_nodes.append(seed)color_list = ['brown','orange','r','g','b','y','m','gray','black','c','pink','brown','orange','r','g','b','y','m','gray','black','c','pink']
res = [[seed]]
for i in range(max_iter_num):new_active = list()t1 = '%s time' % i + ' %s nodes' % len(all_active_nodes)print(t1) # 当前有多少个节点激活# 画图# plt.title(t1)# nx.draw(activated_graph, with_labels=True,node_color=color_list[i])# plt.show()for v in start_influence_nodes:for nbr in G.neighbors(v): if G.node[nbr]['state'] == 0: # 如果这个邻居没被激活edge_data = G.get_edge_data(v, nbr)if random.uniform(0, 1) < edge_data['weight']:G.node[nbr]['state'] = 1new_active.append(nbr)# activated_graph.add_edge(v, nbr) # 画图 添加边print('激活',new_active)start_influence_nodes.clear() # 将原先的有个影响力的清空start_influence_nodes.extend(new_active) # 将新被激活的节点添加到有影响力all_active_nodes.extend(new_active) # 将新被激活的节点添加到激活的列表中res.append(new_active)print('all_active_nodes',all_active_nodes) # 打印
# print(res)res = [c for c in res if c]
pos = nx.spring_layout(G) # 节点的布局为spring型
nx.draw(G,pos, with_labels=True, node_color='w', node_shape = '.')
color_list = ['brown','orange','r','g','b','y','m','gray','black','c','pink','brown','orange','r','g','b','y','m','gray','black','c','pink']
for i in range(len(res)):nx.draw_networkx_nodes(G, pos, with_labels=True, node_color=color_list[i], nodelist=res[i])
plt.show()结果图:
SI模型的python实现更新版(2020.09.03)
import randomimport matplotlib.pyplot as plt
import networkx as nx
import numpy as npmax_iter_num = 5 # 模拟的次数
G = nx.karate_club_graph() # 空手道俱乐部for edge in G.edges:G.add_edge(edge[0], edge[1], weight=random.uniform(0,1)) # 可不可以作为权值 病毒的感染能力
for node in G:G.add_node(node, state = 0) # 用state标识状态 state=0 未感染,state=1 激活seed = 33 # 选定33作为传染源
G.node[seed]['state'] = 1 # 表示33是感染的all_infect_nodes = [] # 所有被感染的节点放在这里
all_infect_nodes.append(seed)
res = [[seed]]# infected_graph = nx.Graph() # 被激活的图
# infected_graph.add_node(seed)for i in range(max_iter_num):new_infect = list() # 新被感染的t1 = '%s time' % i + ' %s nodes' % len(all_infect_nodes)print(t1) # 当前有多少个节点被感染# 画图# plt.title(t1)# nx.draw(infected_graph, with_labels=True)# plt.show()# 感染的机会不止一次for v in all_infect_nodes:for nbr in G.neighbors(v):if G.node[nbr]['state'] == 0: # 如果这个邻居节点没被感染edge_data = G.get_edge_data(v, nbr)if random.uniform(0, 1) < edge_data['weight']:G.node[nbr]['state'] = 1new_infect.append(nbr)# infected_graph.add_edge(v, nbr) # 画图 添加边res.append(new_infect)all_infect_nodes.extend(new_infect) # 将新感染的添加到print('all_active_nodes:', all_infect_nodes)res = [c for c in res if c]
pos = nx.spring_layout(G) # 节点的布局为spring型
nx.draw(G,pos, with_labels=True, node_color='w', node_shape = '.')
color_list = ['brown','orange','r','g','b','y','m','gray','black','c','pink','brown','orange','r','g','b','y','m','gray','black','c','pink']
for i in range(len(res)):nx.draw_networkx_nodes(G, pos, with_labels=True, node_color=color_list[i], nodelist=res[i])
plt.show()
结果:
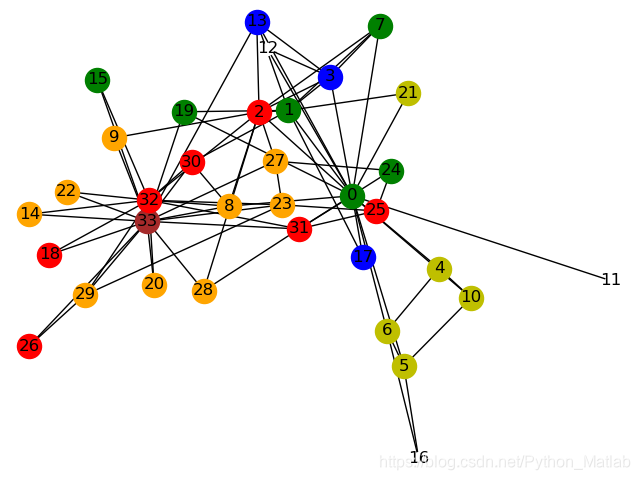
- 说在最后,因为是随机的,所以每次运行的结果可能是不一样的