一些LaTeX中表格的使用方法如下:
1.table
\documentclass{article}\begin{document}\begin{table}[h]\centering\begin{tabular}{|l|c|c|}\hlineSetting&\multicolumn{2}{c|}{A4 size paper}\\\hline&mm&inches\\Top&25&1.0\\Bottom&25&1.0\\Left&20&0.8\\Right&20&0.8\\Column Width&82&3.2\\Column Spacing&6&0.25\\\hline\end{tabular}\caption{Margin settings for A4 size paper}\label{tab:Margin_settings}\end{table}\end{document}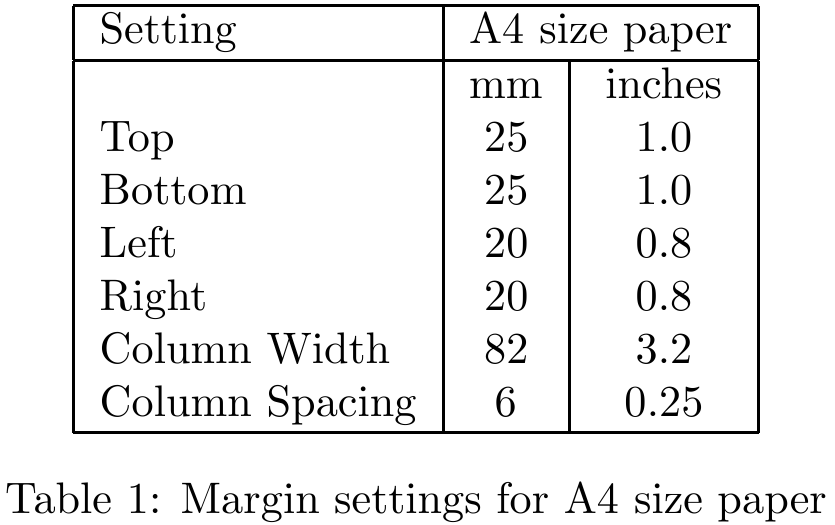
2.tabular
\begin{tabular}{|c|c|c|}\hline 2&9&4\\\hline 7&5&3\\\hline 6&1&8\\\hline
\end{tabular}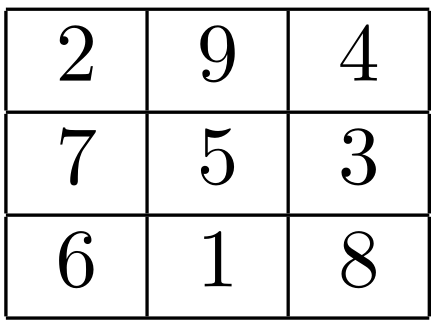
例子里面的|c|这样的,那个地方叫做导言区,来约定表格的每列属性的:
l | left-justified column |
c | centered column |
r | right-justified column |
b | bottom |
c | center (default) |
t | top |
p{'width'} | paragraph column with text vertically aligned at the top |
m{'width'} | paragraph column with text vertically aligned in the middle (requires array package) |
b{'width'} | paragraph column with text vertically aligned at the bottom (requires array package) |
| | vertical line |
|| | double vertical line |
另外,还有一些常用的命令:
& | column separator |
\\ | start new row (additional space may be specified after \\ using square brackets, such as \\[6pt] |
\hline | horizontal line |
\newline | start a new line within a cell (in a paragraph column) |
\tabularnewline | start a new line within a cell (in a paragraph column) instead of \\ to avoid a Misplaced \noalign error in the tabular |
\cline{i-j} | partial horizontal line beginning in column i and ending in column j |
除了最简单的用例外,还可以这样:
% example 1:
\begin{center}\begin{tabular}{ | l || c || r }\hline1 & 2 & 3 \\ \hline4 & 5 & 6 \\ \hline \hline7 & 8 & 9 \\\hline\end{tabular}
\end{center}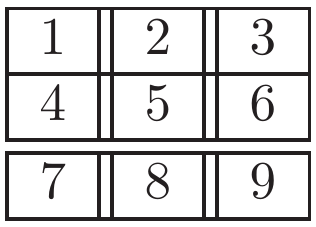
example 1 % example 2:
%\multicolumn{n}{format}{item}
\begin{tabular}{|c|c|c|}\hline \multicolumn{3}{|c|}{?}\\\hline 7&5&3\\\hline 6&1&8\\\hline
\end{tabular}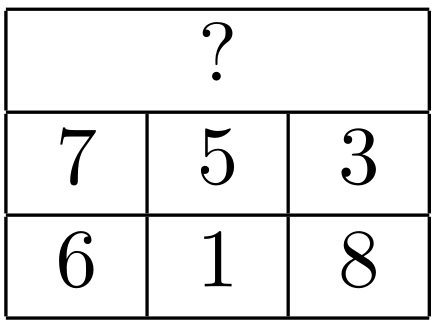
example 2 % example 3:
\begin{tabular}{|r|l|}\hline7C0 & hexadecimal \\3700 & octal \\ \cline{2-2}11111000000 & binary \\\hline \hline1984 & decimal \\\hline
\end{tabular}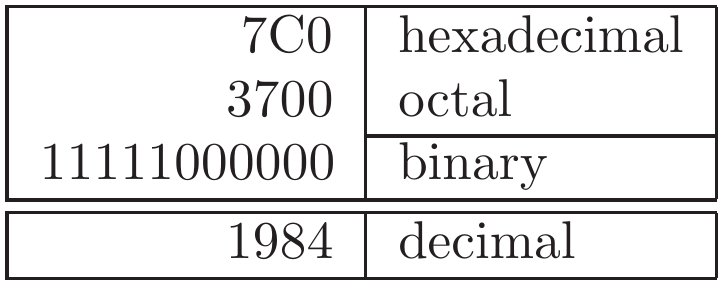
example 3 在array环境中(使用时需要包含:\usepackage{array}),重新实现了tabular环境,加了不少新选项进去:
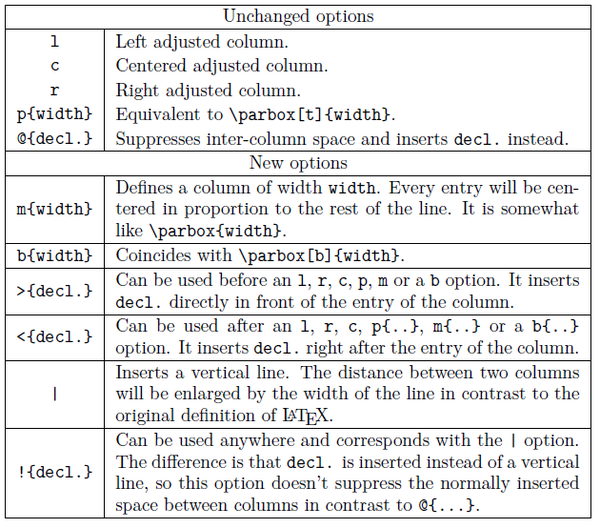
对于tabular的第一个例子略作修改,可以发现在不含有array包和含有时效果是不一样的:
% example 1:
%\usepackage{array}
\tabcolsep20pt
\arrayrulewidth2pt
\begin{tabular}{*{3}{|c}|}
%\begin{tabular}{|c|c|c|}\hline 2&9&4\\\hline 7&5&3\\\hline 6&1&8\\\hline
\end{tabular}% example 2:
...
\usepackage{array}
...\tabcolsep20pt
\arrayrulewidth2pt
\begin{tabular}{*{3}{|c}|}
%\begin{tabular}{|c|c|c|}\hline 2&9&4\\\hline 7&5&3\\\hline 6&1&8\\\hline
\end{tabular}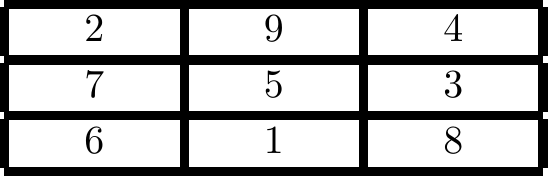
example 1 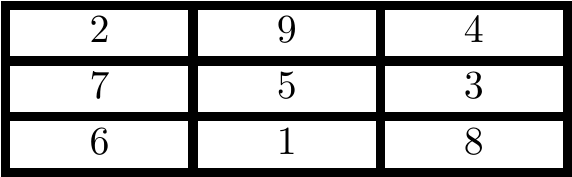
example 2 对于表格内有长文本时,直接排下来不但很难看而且很容超出页面的范围,可以这么做:
Without specifying width for last column:
\begin{center}\begin{tabular}{| l | l | l | l |}\hlineDay & Min Temp & Max Temp & Summary \\ \hlineMonday & 11C & 22C & A clear day with lots of sunshine.However, the strong breeze will bring down the temperatures. \\ \hlineTuesday & 9C & 19C & Cloudy with rain, across many northern regions. Clear spells across most of Scotland and Northern Ireland, but rain reaching the far northwest. \\ \hlineWednesday & 10C & 21C & Rain will still linger for the morning. Conditions will improve by early afternoon and continue throughout the evening. \\\hline\end{tabular}
\end{center}With width specified:
\begin{center}\begin{tabular}{ | l | l | l | p{5cm} |}\hlineDay & Min Temp & Max Temp & Summary \\ \hlineMonday & 11C & 22C & A clear day with lots of sunshine.  However, the strong breeze will bring down the temperatures. \\ \hlineTuesday & 9C & 19C & Cloudy with rain, across many northern regions. Clear spells across most of Scotland and Northern Ireland, but rain reaching the far northwest. \\ \hlineWednesday & 10C & 21C & Rain will still linger for the morning. Conditions will improve by early afternoon and continue throughout the evening. \\\hline\end{tabular}
\end{center}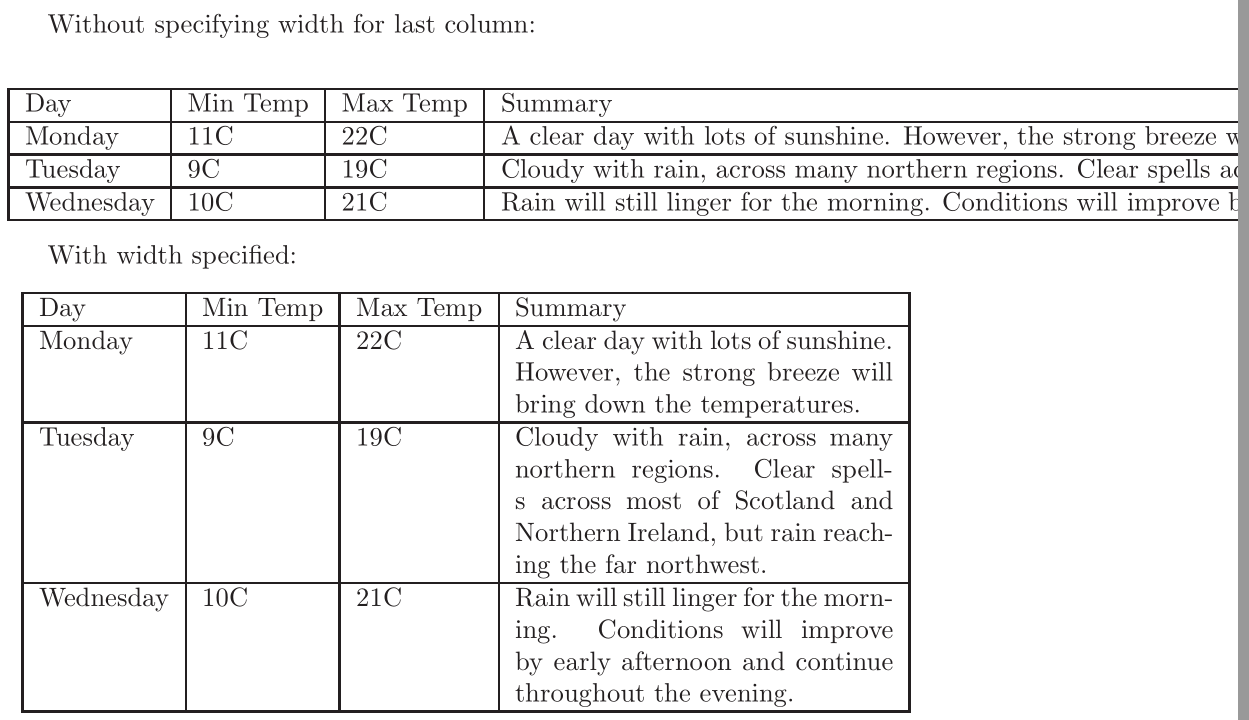
另外使用宏包tabulary也可以实现:
\usepackage{tabulary}
...\begin{center}\begin{tabulary}{0.7\textwidth}{LCL}Short sentences      & \#  & Long sentences                                                 \\\hlineThis is short.       & 173 & This is much loooooooonger, because there are many more words.  \\This is not shorter. & 317 & This is still loooooooonger, because there are many more words. \\\end{tabulary}
\end{center}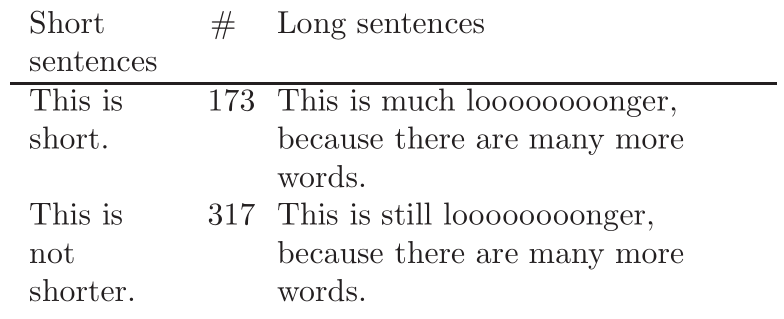
其中的对齐方式除了
L
,
C
外,还有
R
,
J
。
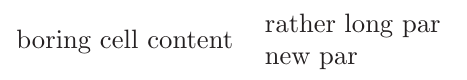
让我们看下\parbox的用法,如果我们想把文段分割成为表的形式:
\begin{tabular}{cc}boring cell content & \parbox[t]{5cm}{rather long par\\new par}
\end{tabular}- 1
- 2
- 3
调整行列间距可以使用命令:
\setlength{\tabcolsep}{5pt} %colums, default value is 6pt\renewcommand{\arraystretch}{1.5} %rows, default value is 1.0另外一种方式是在\hline和cline{i-j}后添加\noalign{\smallskip}, 例如:
\begin{center}\begin{tabular}{ | l | l | r | }\hline\multicolumn{2}{c}{Item} \\\cline{1-2}Animal & Description & Price (\$) \\\hlineGnat & per gram & 13.65 \\& each & 0.01 \\Gnu & stuffed & 92.50 \\Emu & stuffed & 33.33 \\Armadillo & frozen & 8.99 \\\hline\end{tabular}example 1$ $\setlength{\tabcolsep}{4pt}\begin{tabular}{ | l | l | r | }\hline\multicolumn{2}{c}{Item} \\\cline{1-2}Animal & Description & Price (\$) \\\hlineGnat & per gram & 13.65 \\& each & 0.01 \\Gnu & stuffed & 92.50 \\Emu & stuffed & 33.33 \\Armadillo & frozen & 8.99 \\\hline\end{tabular}example 2$ $\renewcommand{\arraystretch}{1.5}\begin{tabular}{ | l | l | r | }\hline\multicolumn{2}{c}{Item} \\\cline{1-2}Animal & Description & Price (\$) \\\hlineGnat & per gram & 13.65 \\& each & 0.01 \\Gnu & stuffed & 92.50 \\Emu & stuffed & 33.33 \\Armadillo & frozen & 8.99 \\\hline\end{tabular}example 3$ $\setlength{\tabcolsep}{6pt}\renewcommand{\arraystretch}{1.0}\begin{tabular}{ | l | l | r | }\hline\noalign{\smallskip}\multicolumn{2}{c}{Item} \\\cline{1-2}\noalign{\smallskip}Animal & Description & Price (\$) \\\noalign{\smallskip}\hline\noalign{\smallskip}Gnat & per gram & 13.65 \\& each & 0.01 \\Gnu & stuffed & 92.50 \\Emu & stuffed & 33.33 \\Armadillo & frozen & 8.99 \\\noalign{\smallskip}\hline\end{tabular}example 4\end{center}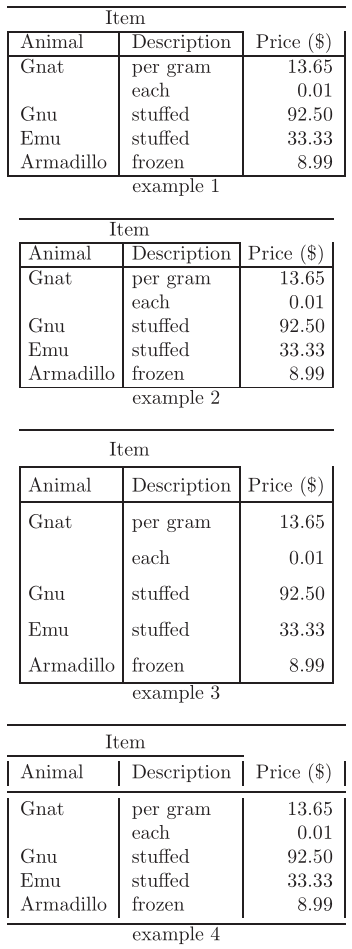
其他用法如在某一行后空出一定间距:
\begin{tabular}{ll}\hlineMineral & Color \\[0.5cm]Ruby & red \\Sapphire & blue \\\hline
\end{tabular}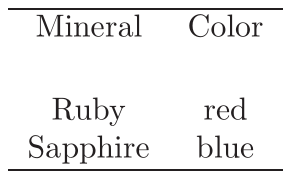
一些LaTeX的环境也可以插入表格中:
\begin{tabular}{m{5cm} c} % here the m can be replaced by p or b.\\ \hline\begin{verbatim}I love coding\end{verbatim}& LaTeX\\ \hline
\end{tabular}
使用列规格设置命令:>{\cmd} and <{\cmd},如设置表格中的字符都是数学手写字体:
...
\usepackage{array}
...\newcolumntype{F}{>{$}c<{$}}
\begin{tabular}{FFF}\alpha & \beta    & \gamma   \\\delta & \epsilon & \upsilon \\\sigma & \tau     & \phi     \\
\end{tabular}
@-expressions的用法:
\begin{tabular}{|@{}l|l@{}|}\hlinestuff & stuff \\ \hlinestuff & stuff \\\hline
\end{tabular}\begin{tabular}{r@{.}l}3   & 14159 \\16  & 2     \\123 & 456   \\
\end{tabular}
行的特别设置,给出几个例子:
\begin{tabular}{ |l|l| }\hline\multicolumn{2}{|c|}{Team sheet} \\\hlineGK & Paul Robinson \\LB & Lucas Radebe \\DC & Michael Duberry \\DC & Dominic Matteo \\RB & Dider Domi \\MC & David Batty \\MC & Eirik Bakke \\MC & Jody Morris \\FW & Jamie McMaster \\ST & Alan Smith \\ST & Mark Viduka \\\hline
\end{tabular}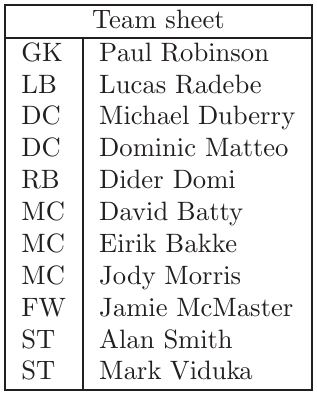
...
\usepackage{multirow}
...\begin{tabular}{ |l|l|l| }\hline\multicolumn{3}{ |c| }{Team sheet} \\\hlineGoalkeeper & GK & Paul Robinson \\ \hline\multirow{4}{*}{Defenders} & LB & Lucas Radebe \\& DC & Michael Duburry \\& DC & Dominic Matteo \\& RB & Didier Domi \\ \hline\multirow{3}{*}{Midfielders} & MC & David Batty \\& MC & Eirik Bakke \\& MC & Jody Morris \\ \hlineForward & FW & Jamie McMaster \\ \hline\multirow{2}{*}{Strikers} & ST & Alan Smith \\& ST & Mark Viduka \\\hline
\end{tabular}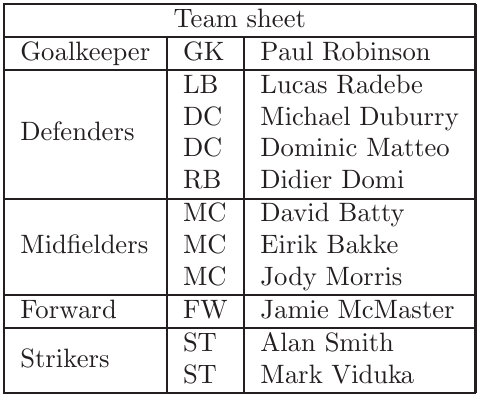
...
\usepackage{multirow}
...\begin{tabular}{cc|c|c|c|c|l}\cline{3-6}& & \multicolumn{4}{ c| }{Primes} \\ \cline{3-6}& & 2 & 3 & 5 & 7 \\ \cline{1-6}\multicolumn{1}{ |c  }{\multirow{2}{*}{Powers} } &\multicolumn{1}{ |c| }{504} & 3 & 2 & 0 & 1 &     \\ \cline{2-6}\multicolumn{1}{ |c  }{}                        &\multicolumn{1}{ |c| }{540} & 2 & 3 & 1 & 0 &     \\ \cline{1-6}\multicolumn{1}{ |c  }{\multirow{2}{*}{Powers} } &\multicolumn{1}{ |c| }{gcd} & 2 & 2 & 0 & 0 & min \\ \cline{2-6}\multicolumn{1}{ |c  }{}                        &\multicolumn{1}{ |c| }{lcm} & 3 & 3 & 1 & 1 & max \\ \cline{1-6}
\end{tabular}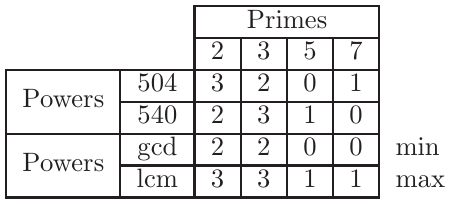
\begin{tabular}{ r|c|c| }\multicolumn{1}{r}{}&  \multicolumn{1}{c}{noninteractive}& \multicolumn{1}{c}{interactive} \\\cline{2-3}massively multiple & Library & University \\\cline{2-3}one-to-one & Book & Tutor \\\cline{2-3}
\end{tabular}
3.booktabs
即三线表:
\usepackage{booktabs}\begin{tabular}{ccc}\toprule2&9&4\\\midrule7&5&3\\6&1&8\\\bottomrule
\end{tabular}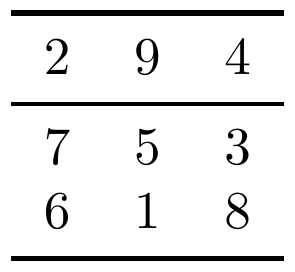
4.colortbl
常用的表格填色colortbl包:
% example 1:
\usepackage{colortbl}\begin{tabular}{ccc}\rowcolor[gray]{.9}2&9&4\\\rowcolor[gray]{.8}7&5&3\\\rowcolor[gray]{.7}6&1&8\\
\end{tabular}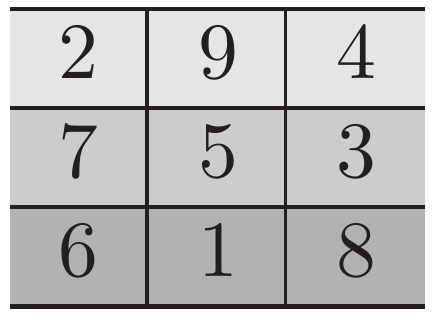
example 1 % example 2:
\begin{tabular}{>{\columncolor[gray]{.9}}c|>{\columncolor[gray]{.8}}c|>{\columncolor[gray]{.7}}c}2&9&4\\7&5&3\\6&1&8\\
\end{tabular}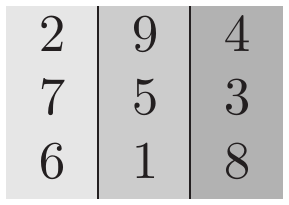
example 2 %example 3:
\begin{tabular}{ccc}\cellcolor[rgb]{.9,.9,.9}2&\cellcolor[rgb]{.8,.9,.9}9&\cellcolor[rgb]{.7,.9,.9}4\\\cellcolor[rgb]{.9,.8,.9}7&\cellcolor[rgb]{.8,.8,.9}5&\cellcolor[rgb]{.7,.8,.9}3\\\cellcolor[rgb]{.9,.7,.9}6&\cellcolor[rgb]{.8,.7,.9}1&\cellcolor[rgb]{.7,.7,.9}8\\
\end{tabular}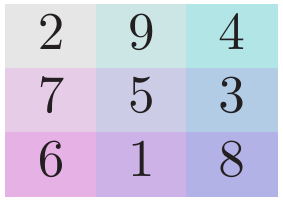
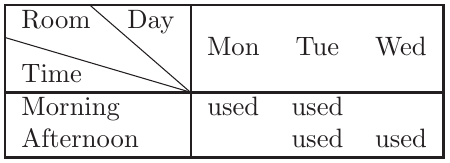
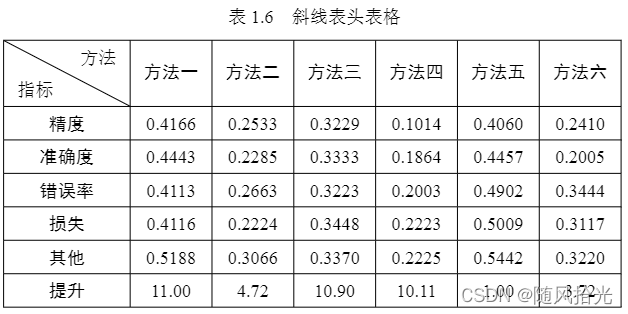
example 3 5.diagbox
画斜线表头的包diagbox
\usepackage{diagbox}
...\begin{tabular}{|l|ccc|}
\hline
\diagbox{Time}{Room}{Day} & Mon & Tue & Wed \\
\hline
Morning & used & used & \\
Afternoon & & used & used \\
\hline
\end{tabular}