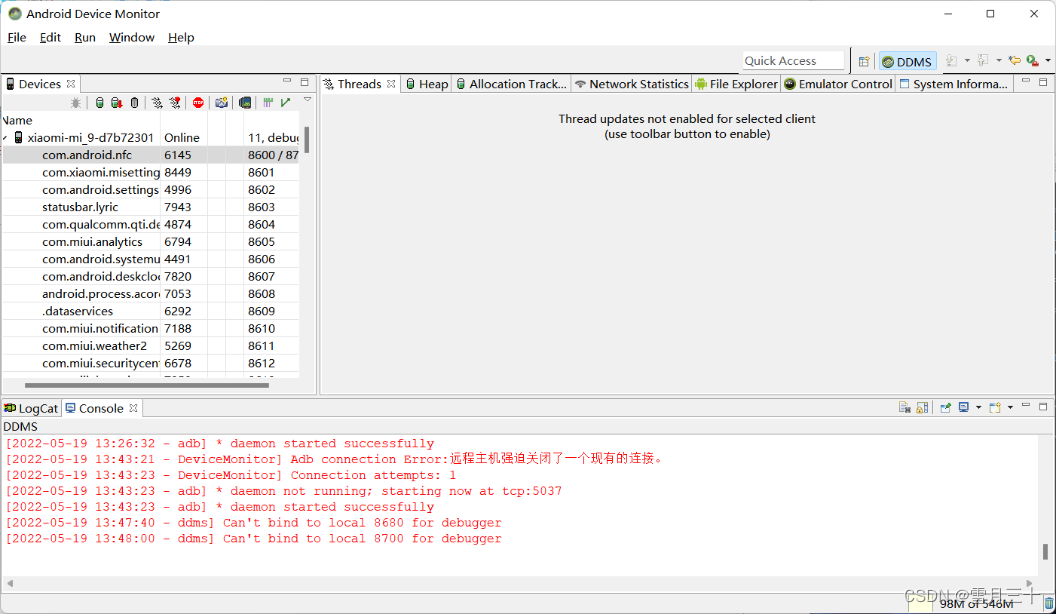
DDMS(Dalvik Debug Monitor Service)
是 Android 开发环境中的Dalvik虚拟机调试监控服务。
AS 3.3 工具箱里面 DDMS,实际上3.X以后这个工具已被替代了,有Layout Inspector布局的调试,Android Profiler 测量应用性能

如果非常想用Android 经典的DDMS工具可以这样查找:
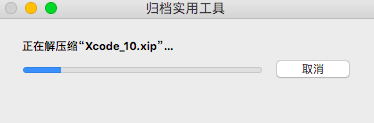
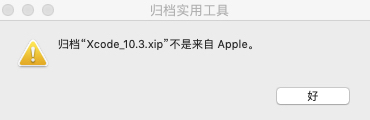
到你安装SDK的目录,找到tools文件夹下的 monitor.bat 双击执行就可以了 ok:

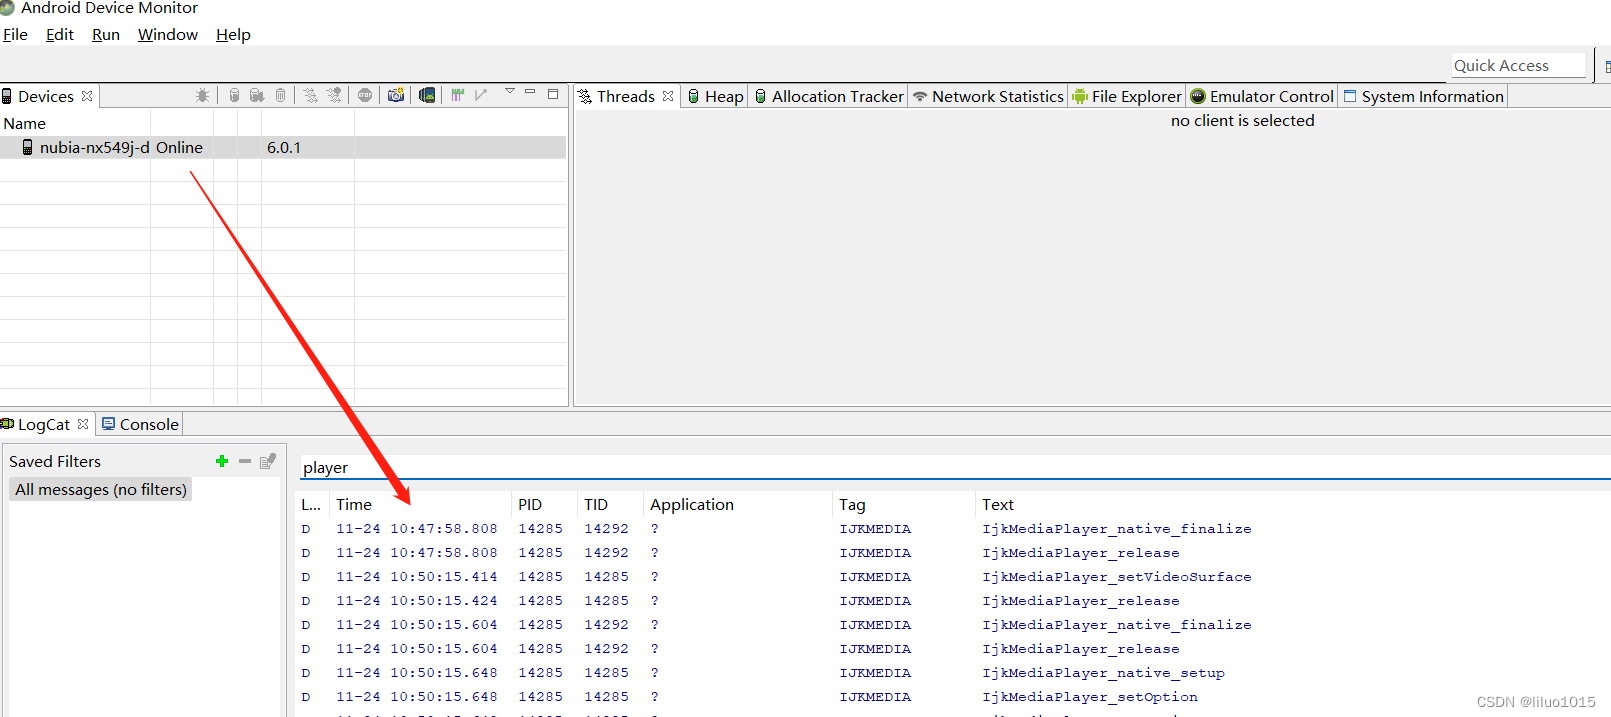
在这里我们要借助这个工具谈一下 jni杀不死的fork进程。
在c里面fork一个新的进程这个进程和JVM分开运行的。
#include<stdio.h>
#include<stdlib.h>
#include<jni.h>
#include <unistd.h>
#include <android/log.h>
#define LOG_TAG "System.out"
#define LOGD(...) __android_log_print(ANDROID_LOG_DEBUG, LOG_TAG, __VA_ARGS__)
#define LOGI(...) __android_log_print(ANDROID_LOG_INFO, LOG_TAG, __VA_ARGS__)
int i =0;
void JNICALL Java_test_com_zh_uninstalllistener_MainActivity_callC(JNIEnv * env, jobject obj){// 测试fork炸弹只能在模拟器Google原生的机器上,小米MIUI和华为的都经过处理了,测试过int flag = fork();LOGI("flag==%d",flag);if(flag==0){// 表示拆分成功// 这是一个死循环while (1){i++;LOGI("我还活着呢");LOGI("flag==%d",i);sleep(1);}}}
app卸载后这个进程一直运行。用adb shell 命令 ps查看进程id(也可以在DDMS上面查看到进程号pid)
然后kill 掉pid 就杀死了。
3.am Activity Manager 活动管理器
am start: start an Activity. Options are:-D: enable debugging-W: wait for launch to complete--start-profiler <FILE>: start profiler and send results to <FILE>--sampling INTERVAL: use sample profiling with INTERVAL microsecondsbetween samples (use with --start-profiler)-P <FILE>: like above, but profiling stops when app goes idle-R: repeat the activity launch <COUNT> times. Prior to each repeat,the top activity will be finished.-S: force stop the target app before starting the activity--opengl-trace: enable tracing of OpenGL functions--user <USER_ID> | current: Specify which user to run as; if notspecified then run as the current user.-a 开启一个Activity
指令解释:
am start -a  android.intent.action.VIEW -d  http://www.baidu.com
am:  Activity Mainager
start : 开启
-a : 开启一个 Activity
android.intent.action.VIEW:  Android的Action
-d : data
后面的就是要开启的百度页面