一,搜索原理
1,前提条件数据准备 a.获取数据 - 从互联网中获取数据 爬虫,网站数据b.建立文档 - 方便本地查询,将之前获取的数据,以文档的样式存在采取专用的存储软件,将文件(Document)存储下来,每个Document里面包含了大量的内容区域(Field)c.词语解析 - 从文档里面提取关键字,便于后续检索提取关键字(Term),便于后续检索d.创建索引 - 将文档和关键字关联在一起倒排索引-根据关键字找文档id2,用户端a.打开web界面找到搜索输入框b.输入关键字c.发起请求d.服务端接收到数据,对数据进行格式化e.服务端解析用户的请求数据f.根据关键字,去后端存储中检索信息g,对检索信息进行排序8.将相关信息返回给用户
二,搜索方案
方案一:ELK + KAFKA +分布式存储适用于中小数据量场景,实时数据多一些。方案二: Spark + Flume + kafka + Hadoop(Hive + Hbase)适用于大数据量场景,离线数据多一些。
三,ELK介绍
1,ELK简介
ELK是一套日志分析平台解决方案,它是由Elastic公司开发,管理和维护的三款开源软件Elasticsearch,Logstash,Kibana的首字母缩写。
2,组成
Elasticsearch - 数据的存储和分析
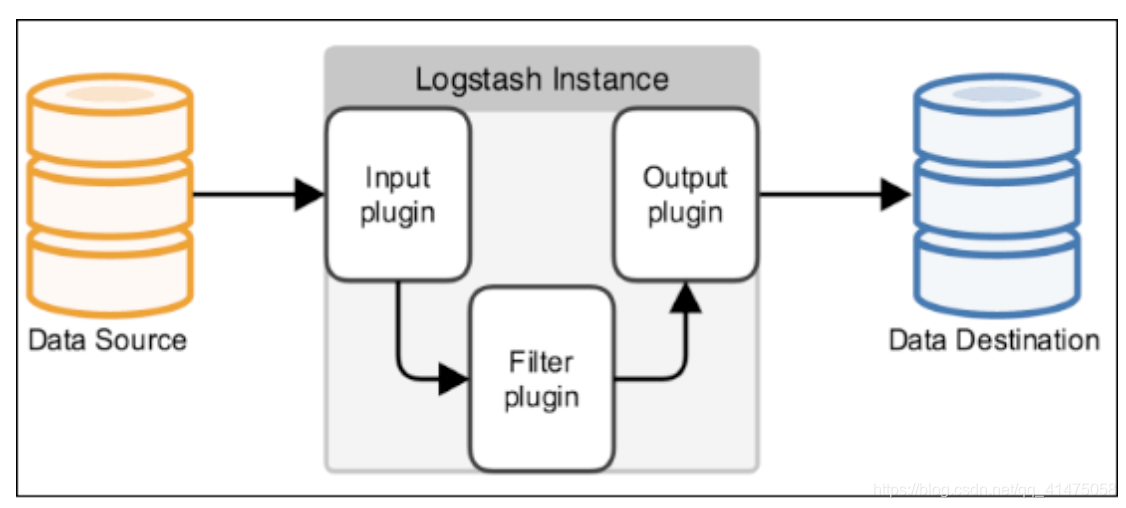
Logstash - 数据分析和传输工具()
Kibana - 数据的可视化(二次处理)
Beats - 数据采集()和传输
对于小型应用项目环境,ELK的四个组件可以实现一个非常经典的组合:

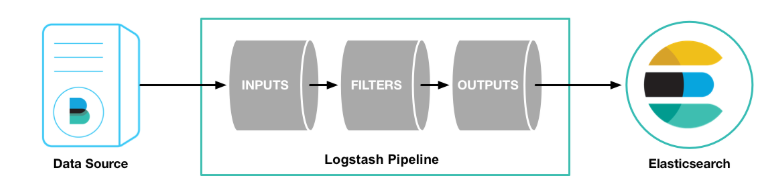
Beats(采集数据)->Logstash(传输数据)->Elasticsearch(数据存储和分析)->Kibana(数据展示)
对于中大型场景,ELK基于丰富的接口可将非常多的功能整合到架构中

四,ELK部署
服务器分布
10.10.10.15 Elasticsearch Elasticsearch_head
10.10.10.16 Elasticsearch logstash
10.10.10.17 kibana
10.10.10.18 filebeat + 项目代码
1,部署Elasticsearch(15和16上)
1.1,下载安装包 :
https://artifacts.elastic.co/downloads/elasticsearch/elasticsearch-7.15.1-linux-x86_64.tar.gz
1.2,创建普通用户elk
1.3,上传安装包到普通用户下
1.4,解压安装包
1.5,修改配置文件(两台服务器上面只有node.name配置成各自的,其他都一样)
17:cluster.name: my-application
23:node.name: 10.10.10.15
33:path.data: /home/elk/elasticsearch/data
37:path.logs: /home/elk/elasticsearch/logs
56:network.host: 0.0.0.0
61:http.port: 9200
70:discovery.seed_hosts: ["10.10.10.15", "10.10.10.16"]
74:cluster.initial_master_nodes: ["10.10.10.15"]
83:http.cors.enabled: true
84:http.cors.allow-origin: "*"
1.6,启动服务
[elk@localhost elasticsearch]$ elasticsearch -d报错:
bootstrap check failure [1] of [3]: max file descriptors [4096] for elasticsearch process is too low, increase to at least [65535]
bootstrap check failure [2] of [3]: max number of threads [3795] for user [elk] is too low, increase to at least [4096]
bootstrap check failure [3] of [3]: max virtual memory areas vm.max_map_count [65530] is too low, increase to at least [262144]解决办法:
vim /etc/security/limits.conf 在文件末尾添加如下内容:elk hard nofile 65536
elk soft nofile 65536elk  soft nproc  4096
elk  hard nproc  4096在/etc/sysctl.conf文件最后添加一行vm.max_map_count=262144[root@localhost ~]# sysctl -p
vm.max_map_count = 262144
1.7,测试服务是否安装正常
http://10.10.10.15:9200/_cat/nodes?vip          heap.percent ram.percent cpu load_1m load_5m load_15m node.role   master name
10.10.10.16           12          95   0    0.00    0.02     0.05 cdfhilmrstw *      10.10.10.16
10.10.10.15           32          96   0    0.03    0.03     0.07 cdfhilmrstw -      10.10.10.15
1.8,命令行操作简介
查看集群信息
[root@localhost soft]# curl -XGET 10.10.10.15:9200/_cat
=^.^=
/_cat/allocation
/_cat/shards
/_cat/shards/{index}
/_cat/master
/_cat/nodes
/_cat/tasks
/_cat/indices
/_cat/indices/{index}
/_cat/segments
/_cat/segments/{index}
/_cat/count
/_cat/count/{index}
/_cat/recovery
/_cat/recovery/{index}
/_cat/health
/_cat/pending_tasks
/_cat/aliases
/_cat/aliases/{alias}
/_cat/thread_pool
/_cat/thread_pool/{thread_pools}
/_cat/plugins
/_cat/fielddata
/_cat/fielddata/{fields}
/_cat/nodeattrs
/_cat/repositories
/_cat/snapshots/{repository}
/_cat/templates
/_cat/ml/anomaly_detectors
/_cat/ml/anomaly_detectors/{job_id}
/_cat/ml/trained_models
/_cat/ml/trained_models/{model_id}
/_cat/ml/datafeeds
/_cat/ml/datafeeds/{datafeed_id}
/_cat/ml/data_frame/analytics
/_cat/ml/data_frame/analytics/{id}
/_cat/transforms
/_cat/transforms/{transform_id}查看节点信息
[root@localhost soft]# curl -XGET 10.10.10.15:9200/_cat/nodes
10.10.10.16 14 95 0 0.01 0.02 0.05 cdfhilmrstw * 10.10.10.16
10.10.10.15 34 96 0 0.00 0.01 0.05 cdfhilmrstw - 10.10.10.15查看索引
[root@localhost soft]# curl -XGET 10.10.10.15:9200/_cat/indices
green open .geoip_databases QPvdLLrTR7eBmLV7uAEWjg 1 1 41 0 79.6mb 39.8mb创建索引
[root@localhost soft]# curl -XPUT 10.10.10.15:9200/myindex
{"acknowledged":true,"shards_acknowledged":true,"index":"myindex"}[root@localhost soft]#格式化展示(以json格式显示)
[root@localhost soft]# curl 10.10.10.15:9200/myindex?pretty
{"myindex" : {"aliases" : { },"mappings" : { },"settings" : {"index" : {"routing" : {"allocation" : {"include" : {"_tier_preference" : "data_content"}}},"number_of_shards" : "1","provided_name" : "myindex","creation_date" : "1634773851554","number_of_replicas" : "1","uuid" : "XyTv0k6_Qm-Hl-7eFtRiXA","version" : {"created" : "7140099"}}}}
}删除索引
[root@localhost soft]# curl -XDELETE 10.10.10.15:9200/myindex
{"acknowledged":true}修改切片属性curl -X PUT 10.10.10.15:9200/myindex -H 'Content-Type:application/json' -d
'{"settings": {"number_of_shards": 3,"number_of_replicas": 1}
}'
1.9,插件安装(分词插件)
命令:elasticsearch-plugin list 查看已经安装的插件elasticsearch-plugin install "插件名称" 安装插件elasticsearch-plugin remove "插件名称" 移除插件root@localhost ~]# elasticsearch-plugin install analysis-smartcn
-> Installing analysis-smartcn
-> Downloading analysis-smartcn from elastic
[=================================================] 100%
-> Installed analysis-smartcn
-> Please restart Elasticsearch to activate any plugins installed[root@localhost ~]# elasticsearch-plugin install analysis-icu
-> Installing analysis-icu-> Downloading analysis-icu from elastic[=================================================] 100%   -> Installed analysis-icu-> Please restart Elasticsearch to activate any plugins installed[root@localhost ~]# ls /usr/share/elasticsearch/plugins/
analysis-icu  analysis-smartcn插件安装好以后要重启服务插件才能生效测试:[root@localhost ~]# curl -X POST 'http://10.10.10.16:9200/_analyze?pretty=true' -H 'content-type: application/json' -d '{
>     "analyzer": "icu_analyzer",
>     "text": "中华人民共和国国歌"
> }'
{"tokens" : [{"token" : "中华","start_offset" : 0,"end_offset" : 2,"type" : "<IDEOGRAPHIC>","position" : 0},{"token" : "人民","start_offset" : 2,"end_offset" : 4,"type" : "<IDEOGRAPHIC>","position" : 1},{"token" : "共和国","start_offset" : 4,"end_offset" : 7,"type" : "<IDEOGRAPHIC>","position" : 2},{"token" : "国歌","start_offset" : 7,"end_offset" : 9,"type" : "<IDEOGRAPHIC>","position" : 3}]
}[root@localhost ~]# curl -X POST 'http://10.10.10.16:9200/_analyze?pretty=true' -H 'content-type: application/json' -d '{
>     "analyzer": "smartcn",
>     "text": "中华人民共和国国歌"
> }'{"tokens" : [{"token" : "中华人民共和国","start_offset" : 0,"end_offset" : 7,"type" : "word","position" : 0},{"token" : "国歌","start_offset" : 7,"end_offset" : 9,"type" : "word","position" : 1}]}
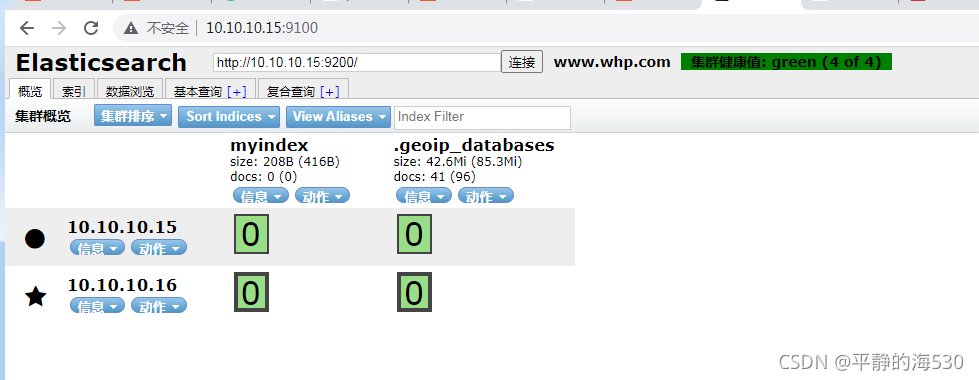
1.10,安装elasticsearch-head插件(10.10.10.15上)
	elasticsearch-head插件是一个提供可视化界面的插件,可以方便对elasticsearch的操作。elasticsearch-head是html5开发的,本质上是个nodejs工程1.10.1,安装nodejswget https://nodejs.org/dist/v10.9.0/node-v10.9.0-linux-x64.tar.gz # 下载nodejs
tar -zxvf node-v10.9.0-linux-x64.tar.gz #解压压缩包
mv node-v10.9.0-linux-x64 /usr/local/nodejs #移动文件到/usr/local目录下,并将文件夹名称改为nodejs
ln -s /usr/local/nodejs/bin/node /usr/bin/node #创建软连接,让node命令全局生效
ln -s /usr/local/nodejs/bin/npm /usr/bin/npm #创建软连接,让npm命令全局生效
node -v #查看nodejs是否安装成功
npm -v 1.10.2,安装git并下载elasticsearch-head[root@localhost elasticsearch-head]# yum install git -y
[root@localhost elasticsearch-head]# git clone git://github.com/mobz/elasticsearch-head.git
[root@localhost elasticsearch-head]# npm config set registry https://registry.npm.taobao.org
[root@localhost elasticsearch-head]# npm install --force1.10.3,修改配置文件[root@localhost elasticsearch-head]# vim Gruntfile.jsoptions: {hostname: '*', #这一行为增加的内容port: 9100,base: '.',keepalive: true}[root@localhost elasticsearch-head]# vim _site/app.jsthis.base_uri = this.config.base_uri || this.prefs.get("app-base_uri") || "http://10.10.10.15:9200"; #ip地址修改成elasticsearch服务节点的地址1.10.4,启动服务[root@localhost elasticsearch-head]# nohup npm run start &[1] 233651.10.5,web页面访问10.10.10.15::9100验证
2,部署Logstash(10.10.10.16上)
Logstash在ELK中主要是用来做数据的采集和传输
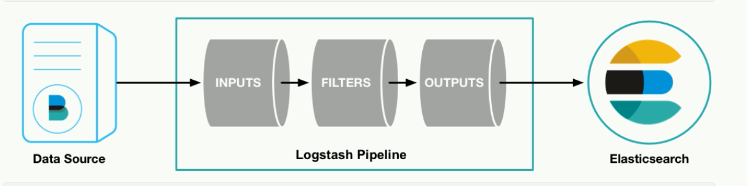
inputs -> filters -> outputs
2.1 下载rpm安装包wget https://artifacts.elastic.co/downloads/logstash/logstash-7.14.0-x86_64.rpm2.2 安装rpm -ivh logstash-7.14.0-x86_64.rpm2.3 配置系统环境变量echo "export PATH=/usr/share/logstash/bin:$PATH" > /etc/profile.d/logstash.shsource /etc/profile.d/logstash.sh2.4 命令行测试2.4.1 简单的输入输出测试[root@localhost soft]# logstash -e 'input { stdin { } } output { stdout {} }'
Using bundled JDK: /usr/share/logstash/jdk
OpenJDK 64-Bit Server VM warning: Option UseConcMarkSweepGC was deprecated in version 9.0 and will likely be removed in a future release.
/usr/share/logstash/vendor/bundle/jruby/2.5.0/gems/bundler-1.17.3/lib/bundler/rubygems_integration.rb:200: warning: constant Gem::ConfigMap is deprecated
WARNING: Could not find logstash.yml which is typically located in $LS_HOME/config or /etc/logstash. You can specify the path using --path.settings. Continuing using the defaults
Could not find log4j2 configuration at path /usr/share/logstash/config/log4j2.properties. Using default config which logs errors to the console
[INFO ] 2021-10-22 03:48:04.307 [main] runner - Starting Logstash {"logstash.version"=>"7.14.0", "jruby.version"=>"jruby 9.2.19.0 (2.5.8) 2021-06-15 55810c552b OpenJDK 64-Bit Server VM 11.0.11+9 on 11.0.11+9 +indy +jit [linux-x86_64]"}
[WARN ] 2021-10-22 03:48:05.165 [LogStash::Runner] multilocal - Ignoring the 'pipelines.yml' file because modules or command line options are specified
[INFO ] 2021-10-22 03:48:08.611 [Api Webserver] agent - Successfully started Logstash API endpoint {:port=>9600}
[INFO ] 2021-10-22 03:48:09.330 [Converge PipelineAction::Create<main>] Reflections - Reflections took 200 ms to scan 1 urls, producing 120 keys and 417 values
[WARN ] 2021-10-22 03:48:10.639 [Converge PipelineAction::Create<main>] stdin - Relying on default value of `pipeline.ecs_compatibility`, which may change in a future major release of Logstash. To avoid unexpected changes when upgrading Logstash, please explicitly declare your desired ECS Compatibility mode.
[INFO ] 2021-10-22 03:48:11.665 [[main]-pipeline-manager] javapipeline - Starting pipeline {:pipeline_id=>"main", "pipeline.workers"=>1, "pipeline.batch.size"=>125, "pipeline.batch.delay"=>50, "pipeline.max_inflight"=>125, "pipeline.sources"=>["config string"], :thread=>"#<Thread:0x4d76ea97 run>"}
[INFO ] 2021-10-22 03:48:13.498 [[main]-pipeline-manager] javapipeline - Pipeline Java execution initialization time {"seconds"=>1.83}
WARNING: An illegal reflective access operation has occurred
WARNING: Illegal reflective access by com.jrubystdinchannel.StdinChannelLibrary$Reader (file:/usr/share/logstash/vendor/bundle/jruby/2.5.0/gems/jruby-stdin-channel-0.2.0-java/lib/jruby_stdin_channel/jruby_stdin_channel.jar) to field java.io.FilterInputStream.in
WARNING: Please consider reporting this to the maintainers of com.jrubystdinchannel.StdinChannelLibrary$Reader
WARNING: Use --illegal-access=warn to enable warnings of further illegal reflective access operations
WARNING: All illegal access operations will be denied in a future release
[INFO ] 2021-10-22 03:48:13.610 [[main]-pipeline-manager] javapipeline - Pipeline started {"pipeline.id"=>"main"}
[INFO ] 2021-10-22 03:48:13.672 [Agent thread] agent - Pipelines running {:count=>1, :running_pipelines=>[:main], :non_running_pipelines=>[]}
The stdin plugin is now waiting for input:
whp
{"message" => "whp","host" => "localhost.localdomain","@version" => "1","@timestamp" => 2021-10-21T19:48:45.034Z
}
hahahaha
{"message" => "hahahaha","host" => "localhost.localdomain","@version" => "1","@timestamp" => 2021-10-21T19:48:56.865Z
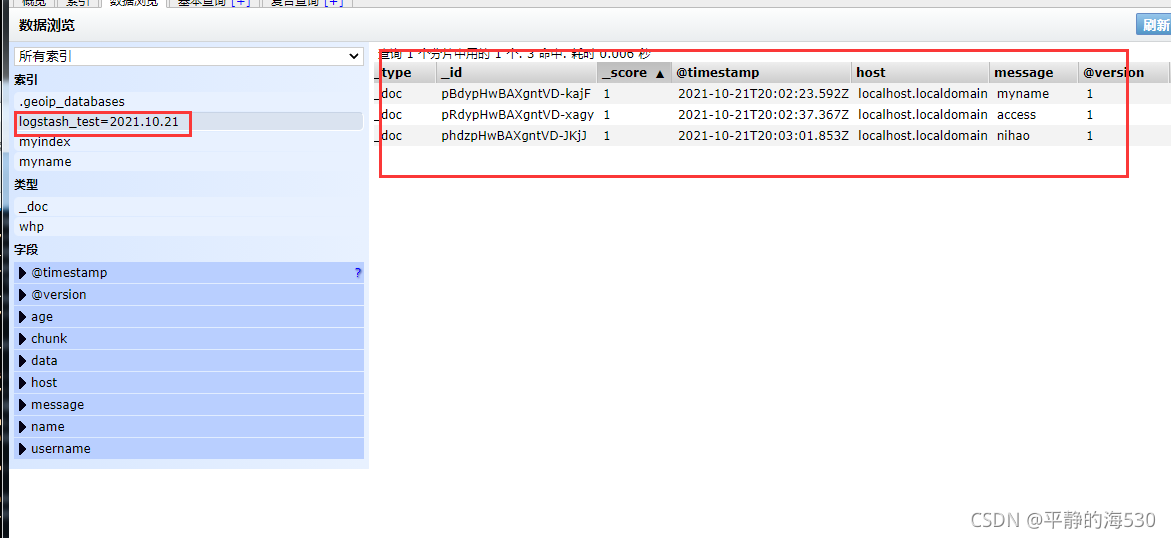
}2.4.2 将Logstash的数据传输到elasticsearch里面[root@localhost soft]# logstash -e 'input { stdin { } } output { elasticsearch{hosts => ["10.10.10.16:9200"] index =>"logstash_test=%{+YYYY.MM.dd}"} }'
Using bundled JDK: /usr/share/logstash/jdk
OpenJDK 64-Bit Server VM warning: Option UseConcMarkSweepGC was deprecated in version 9.0 and will likely be removed in a future release.
/usr/share/logstash/vendor/bundle/jruby/2.5.0/gems/bundler-1.17.3/lib/bundler/rubygems_integration.rb:200: warning: constant Gem::ConfigMap is deprecated
WARNING: Could not find logstash.yml which is typically located in $LS_HOME/config or /etc/logstash. You can specify the path using --path.settings. Continuing using the defaults
Could not find log4j2 configuration at path /usr/share/logstash/config/log4j2.properties. Using default config which logs errors to the console
[INFO ] 2021-10-22 03:59:23.668 [main] runner - Starting Logstash {"logstash.version"=>"7.14.0", "jruby.version"=>"jruby 9.2.19.0 (2.5.8) 2021-06-15 55810c552b OpenJDK 64-Bit Server VM 11.0.11+9 on 11.0.11+9 +indy +jit [linux-x86_64]"}
[WARN ] 2021-10-22 03:59:24.451 [LogStash::Runner] multilocal - Ignoring the 'pipelines.yml' file because modules or command line options are specified
[INFO ] 2021-10-22 03:59:27.140 [Api Webserver] agent - Successfully started Logstash API endpoint {:port=>9600}
[INFO ] 2021-10-22 03:59:28.039 [Converge PipelineAction::Create<main>] Reflections - Reflections took 164 ms to scan 1 urls, producing 120 keys and 417 values
[WARN ] 2021-10-22 03:59:29.069 [Converge PipelineAction::Create<main>] stdin - Relying on default value of `pipeline.ecs_compatibility`, which may change in a future major release of Logstash. To avoid unexpected changes when upgrading Logstash, please explicitly declare your desired ECS Compatibility mode.
[WARN ] 2021-10-22 03:59:29.326 [Converge PipelineAction::Create<main>] elasticsearch - Relying on default value of `pipeline.ecs_compatibility`, which may change in a future major release of Logstash. To avoid unexpected changes when upgrading Logstash, please explicitly declare your desired ECS Compatibility mode.
[INFO ] 2021-10-22 03:59:29.541 [[main]-pipeline-manager] elasticsearch - New Elasticsearch output {:class=>"LogStash::Outputs::ElasticSearch", :hosts=>["//10.10.10.16:9200"]}
[INFO ] 2021-10-22 03:59:30.733 [[main]-pipeline-manager] elasticsearch - Elasticsearch pool URLs updated {:changes=>{:removed=>[], :added=>[http://10.10.10.16:9200/]}}
[WARN ] 2021-10-22 03:59:31.920 [[main]-pipeline-manager] elasticsearch - Restored connection to ES instance {:url=>"http://10.10.10.16:9200/"}
[INFO ] 2021-10-22 03:59:32.181 [[main]-pipeline-manager] elasticsearch - Elasticsearch version determined (7.14.0) {:es_version=>7}
[WARN ] 2021-10-22 03:59:32.182 [[main]-pipeline-manager] elasticsearch - Detected a 6.x and above cluster: the `type` event field won't be used to determine the document _type {:es_version=>7}
[INFO ] 2021-10-22 03:59:32.902 [Ruby-0-Thread-10: :1] elasticsearch - Using a default mapping template {:es_version=>7, :ecs_compatibility=>:disabled}
[INFO ] 2021-10-22 03:59:32.985 [[main]-pipeline-manager] javapipeline - Starting pipeline {:pipeline_id=>"main", "pipeline.workers"=>1, "pipeline.batch.size"=>125, "pipeline.batch.delay"=>50, "pipeline.max_inflight"=>125, "pipeline.sources"=>["config string"], :thread=>"#<Thread:0x68d2b5ec run>"}
[INFO ] 2021-10-22 03:59:33.501 [Ruby-0-Thread-10: :1] elasticsearch - Installing Elasticsearch template {:name=>"logstash"}
[INFO ] 2021-10-22 03:59:36.030 [[main]-pipeline-manager] javapipeline - Pipeline Java execution initialization time {"seconds"=>3.04}
WARNING: An illegal reflective access operation has occurred
WARNING: Illegal reflective access by com.jrubystdinchannel.StdinChannelLibrary$Reader (file:/usr/share/logstash/vendor/bundle/jruby/2.5.0/gems/jruby-stdin-channel-0.2.0-java/lib/jruby_stdin_channel/jruby_stdin_channel.jar) to field java.io.FilterInputStream.in
WARNING: Please consider reporting this to the maintainers of com.jrubystdinchannel.StdinChannelLibrary$Reader
WARNING: Use --illegal-access=warn to enable warnings of further illegal reflective access operations
WARNING: All illegal access operations will be denied in a future release
[INFO ] 2021-10-22 03:59:36.116 [[main]-pipeline-manager] javapipeline - Pipeline started {"pipeline.id"=>"main"}
The stdin plugin is now waiting for input:
[INFO ] 2021-10-22 03:59:36.251 [Agent thread] agent - Pipelines running {:count=>1, :running_pipelines=>[:main], :non_running_pipelines=>[]}
myname
access
nihao
查看elasticsearch里面的数据
2.4.3 使用Logstash读取日志文件并传输到elasticsearch中
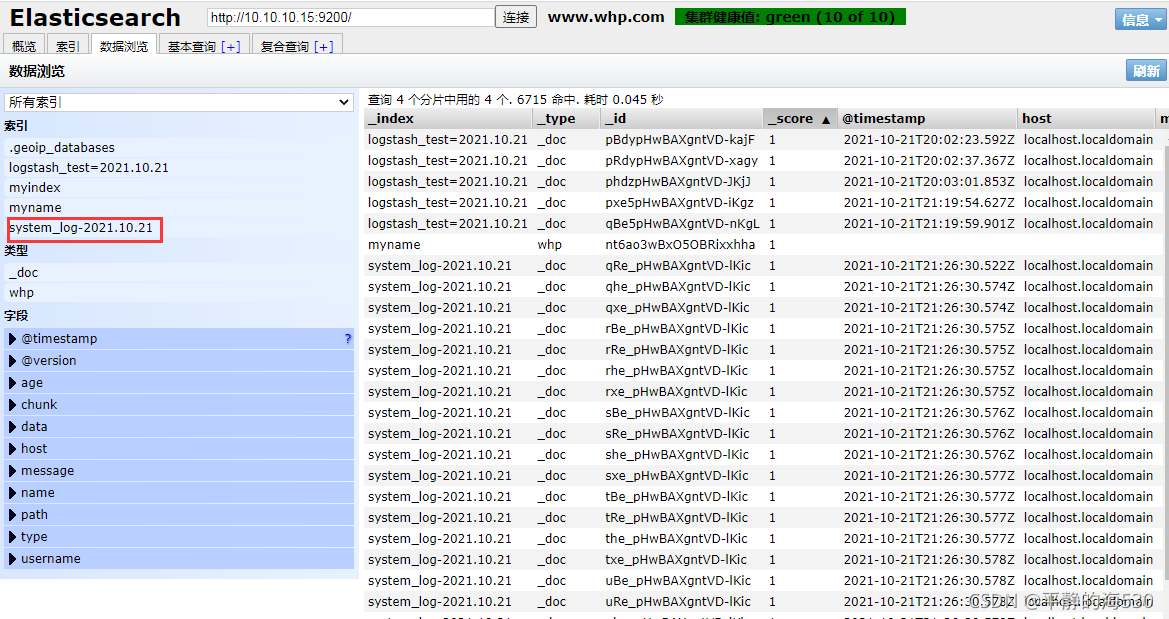
[root@localhost soft]# logstash -e 'input { file {path => "/opt/systemlog" start_position => "beginning" type => "systemlog"} } output { elasticsearch{hosts => ["10.10.10.16:9200"] index =>"system_log-%{+YYYY.MM.dd}"} }' # 把/opt/systemlog 读取并传输到elasticsearch里面,类型为systemlog,索引为system_log-%{+YYYY.MM.dd
2.4.4 配置服务启动脚本
以守护进程方式运行logstash
(1) 定制服务启动参数[root@localhost logstash]# vim /etc/logstash/startup.optionsLS_OPTS="--path.settings ${LS_SETTINGS_DIR} -f /etc/logstash/conf.d"  (配置读取配置文件的位置)(2),修改配置文件root@localhost logstash]# cp /etc/logstash/logstash-sample.conf /etc/logstash/conf.d/logstash.conf修改/etc/logstash/conf.d/logstash.conf在配置文件中可以定义input和output的属性input {
#  beats {
#   port => 5044
#}file {path => "/opt/systemlog"start_position => "beginning"type => "systemlog"}
}output {elasticsearch {hosts => ["http://10.10.10.16:9200"]index => "%{[@metadata][beat]}-%{[@metadata][version]}-%{+YYYY.MM.dd}"}
}2.4.5 执行system-install 命令生成服务启动文件[root@localhost logstash]# system-install Using bundled JDK: /usr/share/logstash/jdk
OpenJDK 64-Bit Server VM warning: Option UseConcMarkSweepGC was deprecated in version 9.0 and will likely be removed in a future release.
/usr/share/logstash/vendor/bundle/jruby/2.5.0/gems/pleaserun-0.0.32/lib/pleaserun/platform/base.rb:112: warning: constant ::Fixnum is deprecated
Successfully created system startup script for Logstash可以看到生成了etc/systemd/system/logstash.service文件[root@localhost logstash]# systemctl daemon-reload
[root@localhost logstash]# systemctl start logstash注:还可以使用 logstash -f /path/xxx.conf命令来临时启动logstash
3,部署Kibana(10.10.10.17上)
Kibana官方文档地址:
https://www.elastic.co/guide/en/kibana/current/index.html 3.1 下载rpm安装包
[root@localhost soft]# wget https://artifacts.elastic.co/downloads/kibana/kibana-7.14.0-x86_64.rpm3.2 安装kibana
[root@localhost soft]# rpm -ivh kibana-7.14.0-x86_64.rpm
警告:kibana-7.14.0-x86_64.rpm: 头V4 RSA/SHA512 Signature, 密钥 ID d88e42b4: NOKEY
准备中...                          ################################# [100%]
正在升级/安装...
1:kibana-7.14.0-1                  ################################# [100%]
Creating kibana group... OK
Creating kibana user... OK
Created Kibana keystore in /etc/kibana/kibana.keystore3.3 配置环境变量
[root@localhost soft]# echo "export PATH=/usr/share/kibana/bin:$PATH" > /etc/profile.d/kibana.sh
[root@localhost soft]# source /etc/profile.d/kibana.sh3.4 修改配置文件
[root@localhost soft]# vim /etc/kibana/kibana.yml
[root@localhost soft]# grep -Env '#|^$' /etc/kibana/kibana.yml
2:server.port: 5601
7:server.host: "0.0.0.0"
32:elasticsearch.hosts: ["http://10.10.10.16:9200"]
36:kibana.index: ".kibana"
90:pid.file: /run/kibana/kibana.pid
111:i18n.locale: "zh-CN"3.5 启动服务
[root@localhost soft]# systemctl start kibana
[root@localhost soft]# systemctl status kibana
● kibana.service - KibanaLoaded: loaded (/etc/systemd/system/kibana.service; disabled; vendor preset: disabled)Active: active (running) since 六 2021-10-23 00:34:29 CST; 2s agoDocs: https://www.elastic.coMain PID: 1370 (node)CGroup: /system.slice/kibana.service├─1370 /usr/share/kibana/bin/../node/bin/node /usr/share/kibana/bin/../src/cli/dist --logging.dest="/va...└─1382 /usr/share/kibana/node/bin/node --preserve-symlinks-main --preserve-symlinks /usr/share/kibana/s...10月 23 00:34:29 localhost.localdomain systemd[1]: Started Kibana.3.6 登录kibana
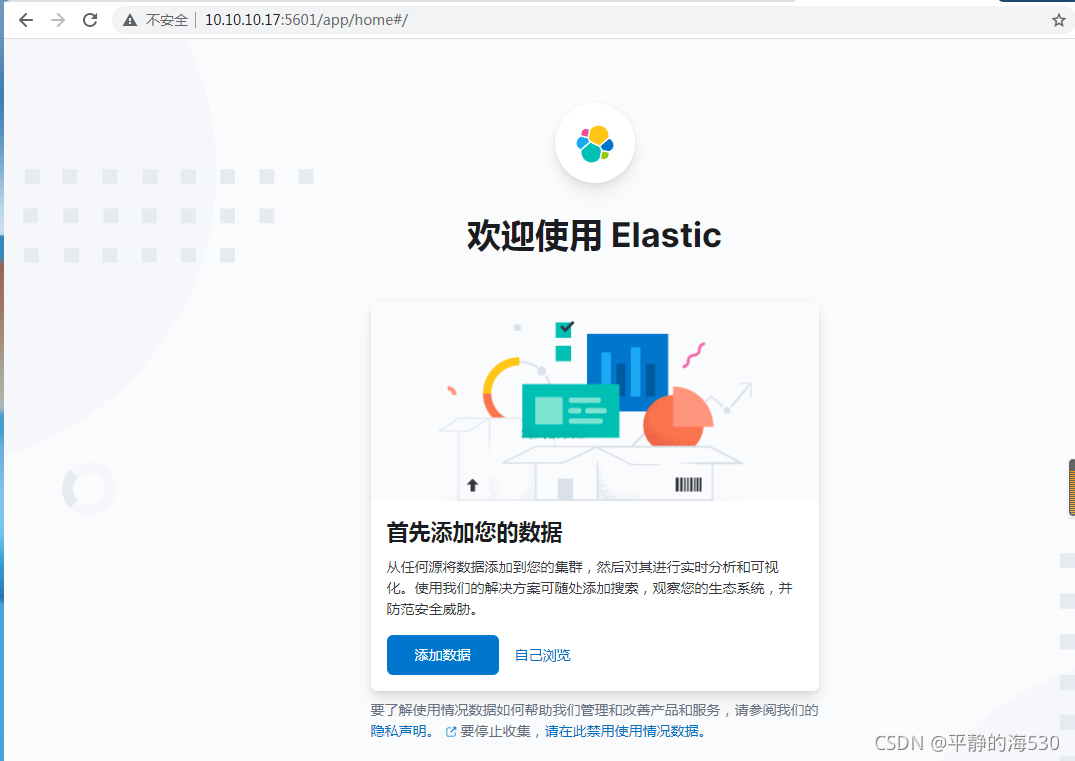
3.7 kibana添加示例数据

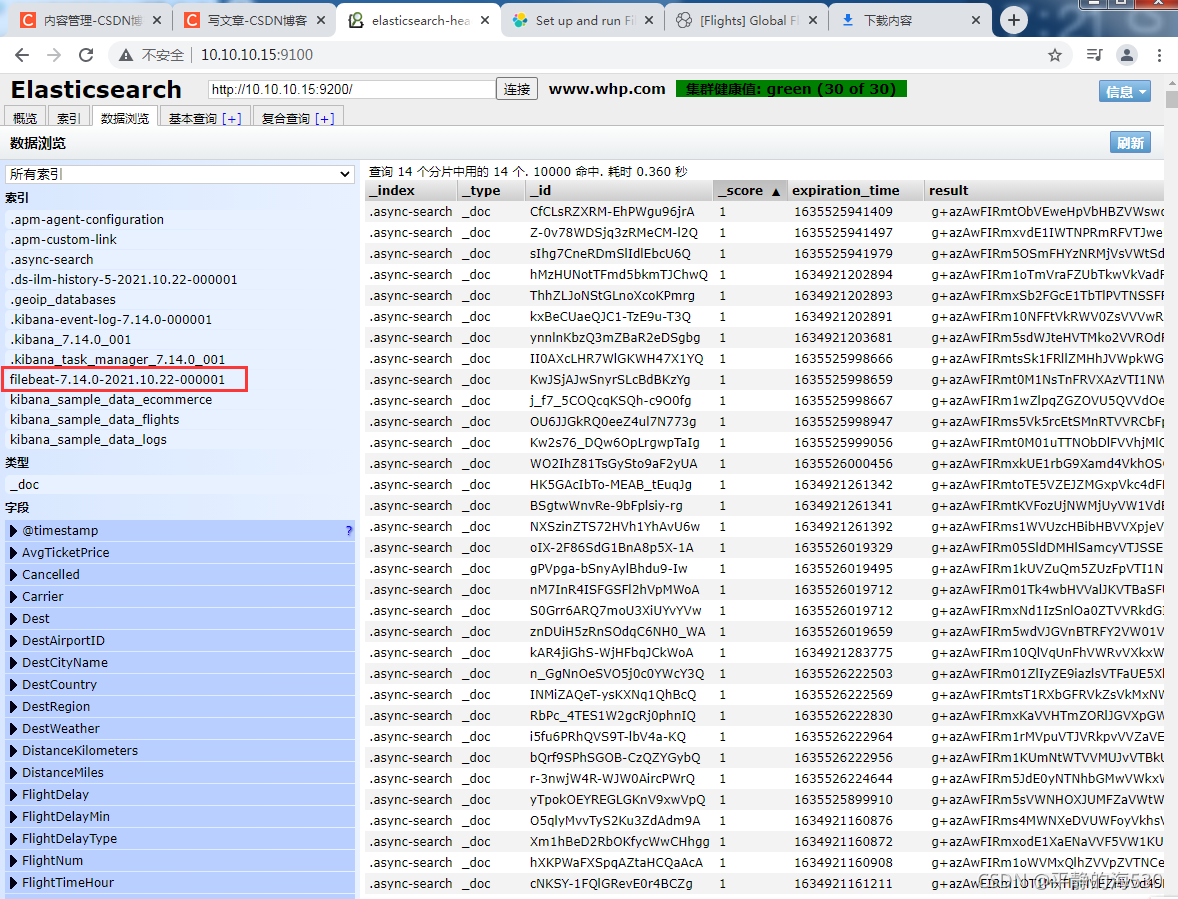
3.8 elasticsearch里面查看添加的示例数据

4,安装FileBeat (10.10.10.18)
FileBeat官方文档地址:https://www.elastic.co/guide/en/beats/filebeat/current/index.html

4.1 下载rpm安装包[root@localhost soft]# wget https://artifacts.elastic.co/downloads/beats/filebeat/filebeat-7.14.0-x86_64.rpm4.2 安装[root@localhost soft]# rpm -ivh filebeat-7.14.0-x86_64.rpm
警告:filebeat-7.14.0-x86_64.rpm: 头V4 RSA/SHA512 Signature, 密钥 ID d88e42b4: NOKEY
准备中...                          ################################# [100%]
正在升级/安装...1:filebeat-7.14.0-1                ################################# [100%]4.3 配置环境变量
[root@localhost soft]# echo 'export PATH=/usr/share/filebeat/bin:$PATH' > /etc/profile.d/filebeat.sh
[root@localhost soft]# source /etc/profile.d/filebeat.sh4.4 配置FileBeat[root@localhost filebeat]# vim filebeat.yml
[root@localhost filebeat]# grep -Env '#|^$' filebeat.yml
15:filebeat.inputs:
21:- type: log
24:  enabled: true
27:  paths:
28:    - /var/log/messages
66:- type: filestream
69:  enabled: false
72:  paths:
73:    - /var/log/*.log
96:filebeat.config.modules:
98:  path: ${path.config}/modules.d/*.yml
101:  reload.enabled: false
108:setup.template.settings:
109:  index.number_of_shards: 5
145:setup.kibana:
176:output.elasticsearch:
178:  hosts: ["10.10.10.16:9200"]
204:processors:
205:  - add_host_metadata:
206:      when.not.contains.tags: forwarded
207:  - add_cloud_metadata: ~
208:  - add_docker_metadata: ~
209:  - add_kubernetes_metadata: ~4.4 启动FileBeat
[root@localhost filebeat]# systemctl start filebeat[root@localhost filebeat]# systemctl start filebeat
[root@localhost filebeat]# systemctl status filebeat
● filebeat.service - Filebeat sends log files to Logstash or directly to Elasticsearch.Loaded: loaded (/usr/lib/systemd/system/filebeat.service; disabled; vendor preset: disabled)Active: active (running) since 六 2021-10-23 01:18:12 CST; 5s agoDocs: https://www.elastic.co/beats/filebeat4.5 查看elasticsearch里面的数据,看filebeat是否把数据采集过来
五,ELK综合实践

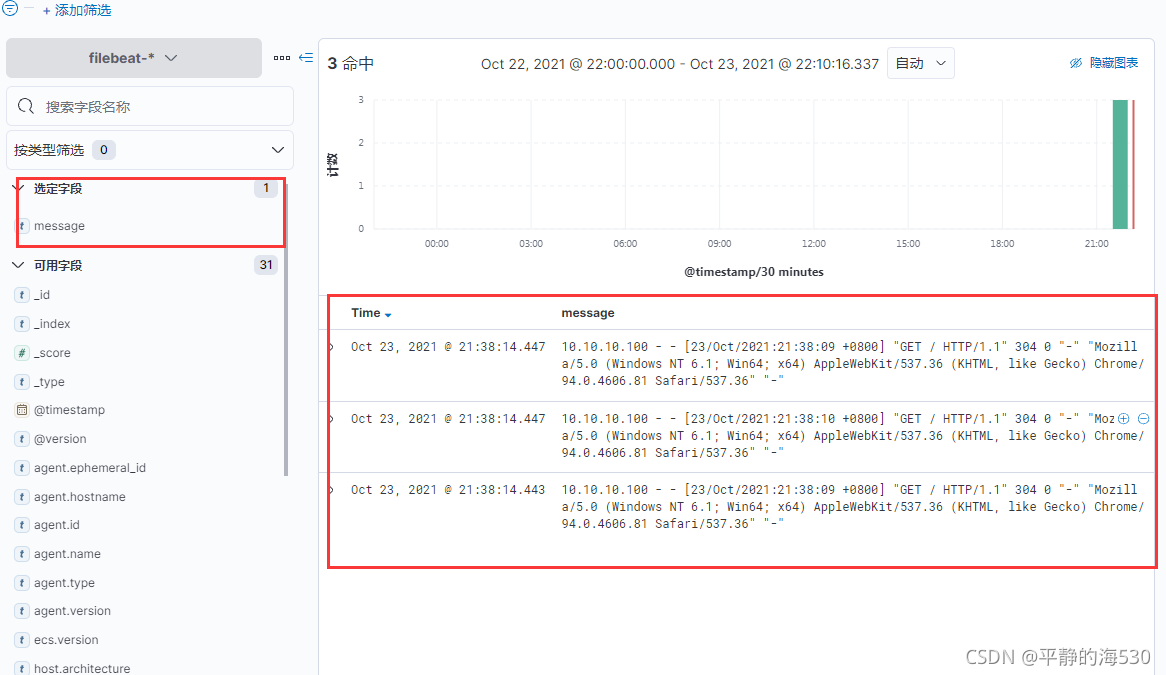
接下来我们使用FileBeat采集Nginx的日志文件,将文件内容传输到Logstash中,Logstash接收到数后,将其定制显示格式后再传输到Elasticsearch中,Kibana从
Elasticsearch中获取数据,并展示到web界面
1,修改配置
上面实验是filebeat直接把数据传输到Elasticsearch,现在要把数据传输到Logstash修改filebeat的配置文件
[root@localhost filebeat]# grep -Env '#|^$' filebeat.yml
15:filebeat.inputs:
21:- type: log
24:  enabled: true
27:  paths:
28:    - /var/log/nginx/*.log
66:- type: filestream
69:  enabled: false
72:  paths:
73:    - /var/log/*.log
96:filebeat.config.modules:
98:  path: ${path.config}/modules.d/*.yml
101:  reload.enabled: false
108:setup.template.settings:
109:  index.number_of_shards: 5
145:setup.kibana:
176:output.logstash:    # output到logstash
178:  hosts: ["10.10.10.16:5044"] # logstash的地址
204:processors:
205:  - add_host_metadata:
206:      when.not.contains.tags: forwarded
207:  - add_cloud_metadata: ~
208:  - add_docker_metadata: ~
209:  - add_kubernetes_metadata: ~修改logstash的配置文件
[root@localhost conf.d]# grep -Env '#|^$' logstash.conf
4:input {
5:  beats {
6:    port => 5044
7:  }
9:}
11:output {
12:  elasticsearch {
13:    hosts => ["http://10.10.10.16:9200"]
14:    index => "%{[@metadata][beat]}-%{[@metadata][version]}-%{+YYYY.MM.dd}"
15:  }
16:}
2,重启logstash,filebeat,kibana服务
[root@localhost conf.d]# systemctl restart logstash
[root@localhost filebeat]# systemctl restart filebeat
[root@localhost ~]# systemctl restart kibana
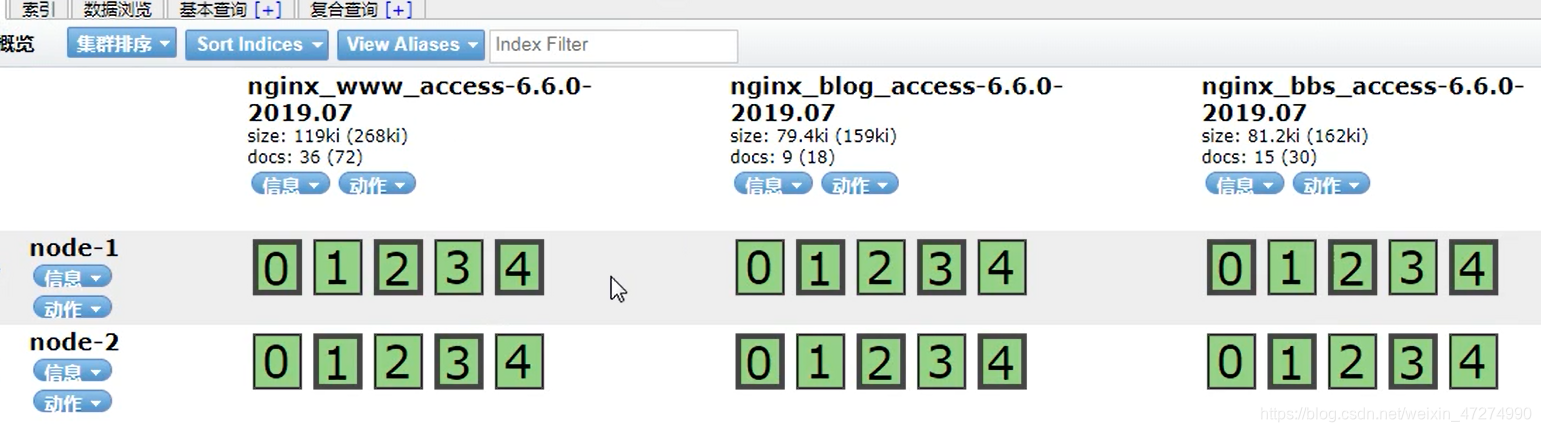
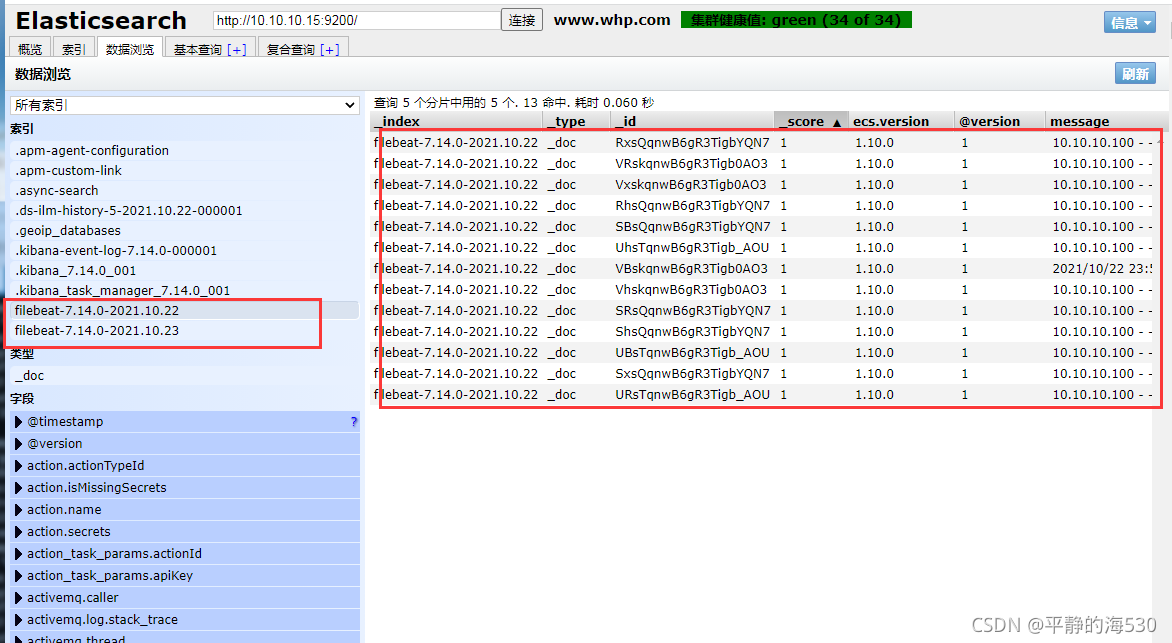
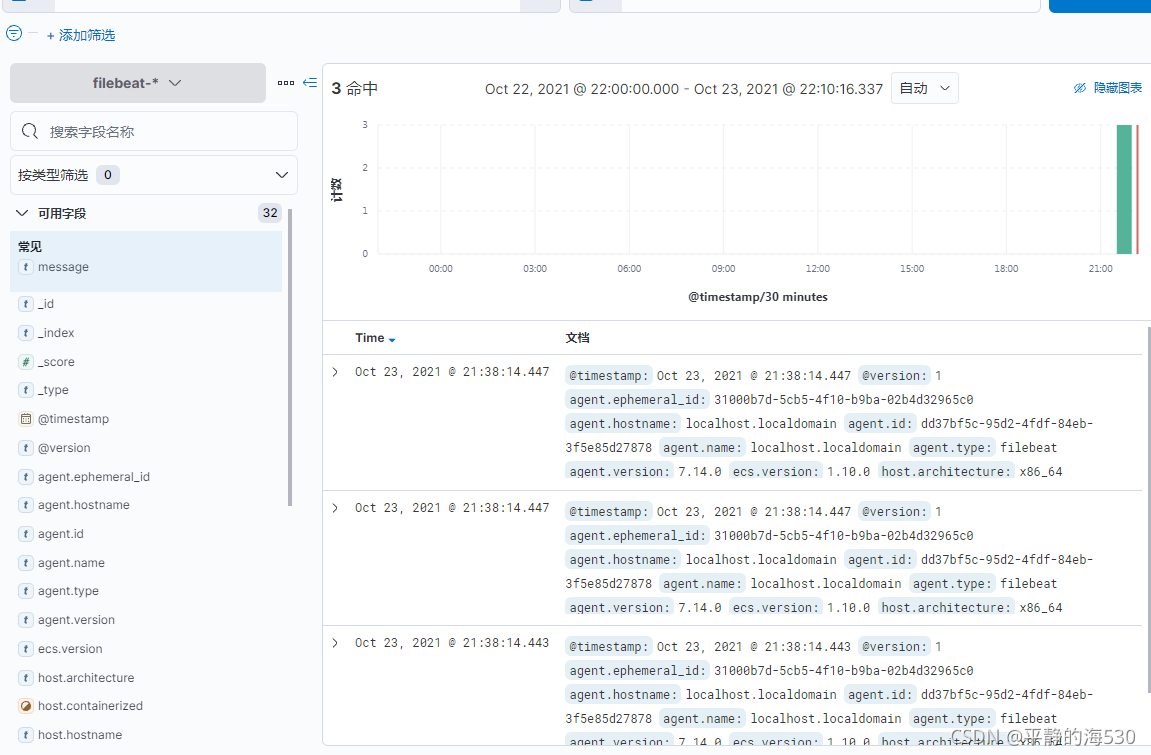
3,查看Elasticsearch的数据
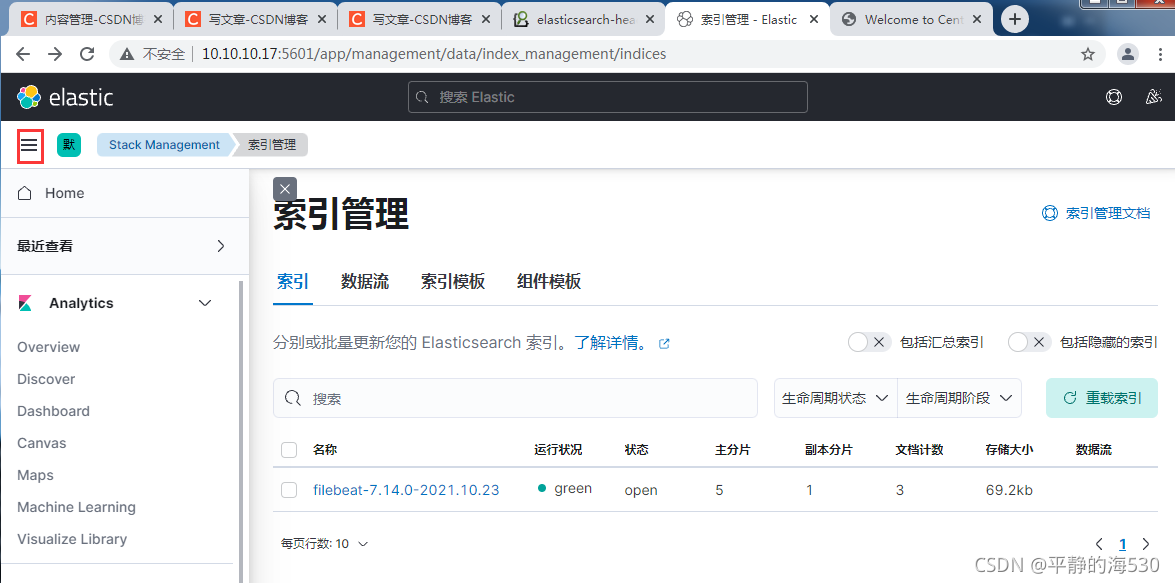
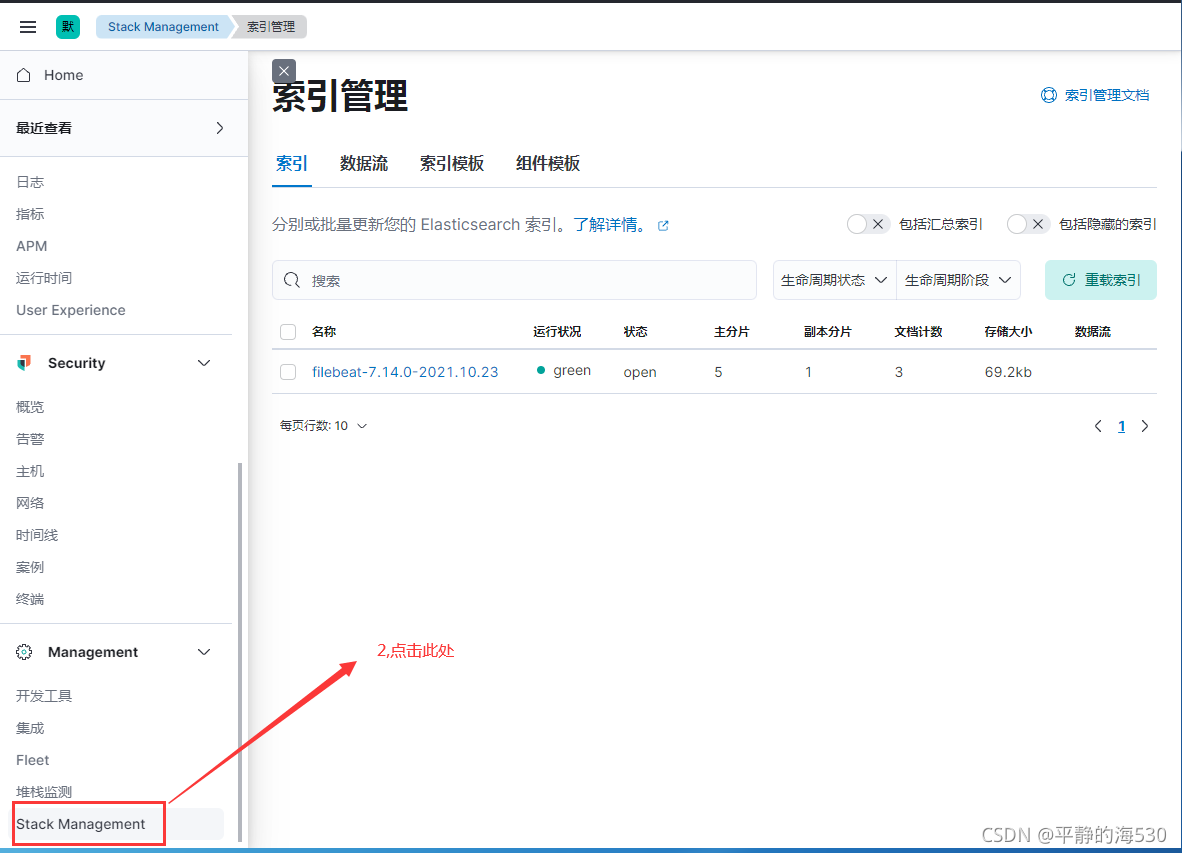
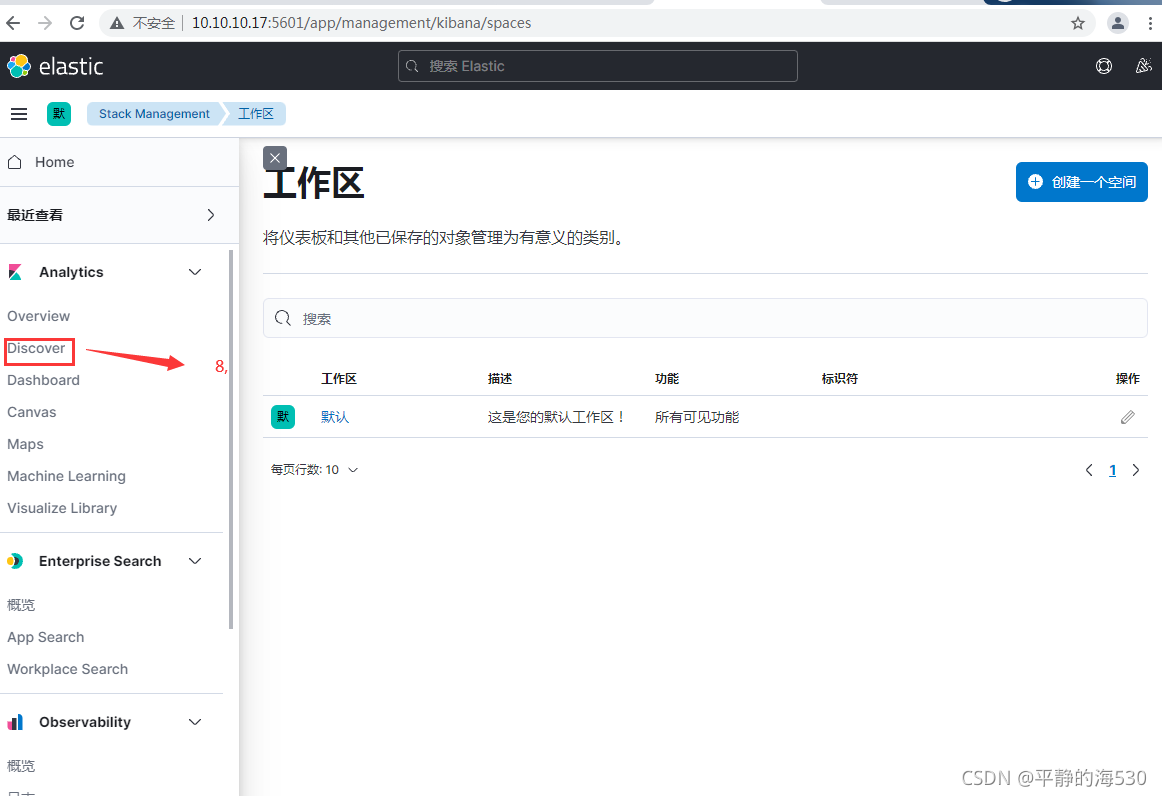
4,配置kibana进行数据展示
步骤1:
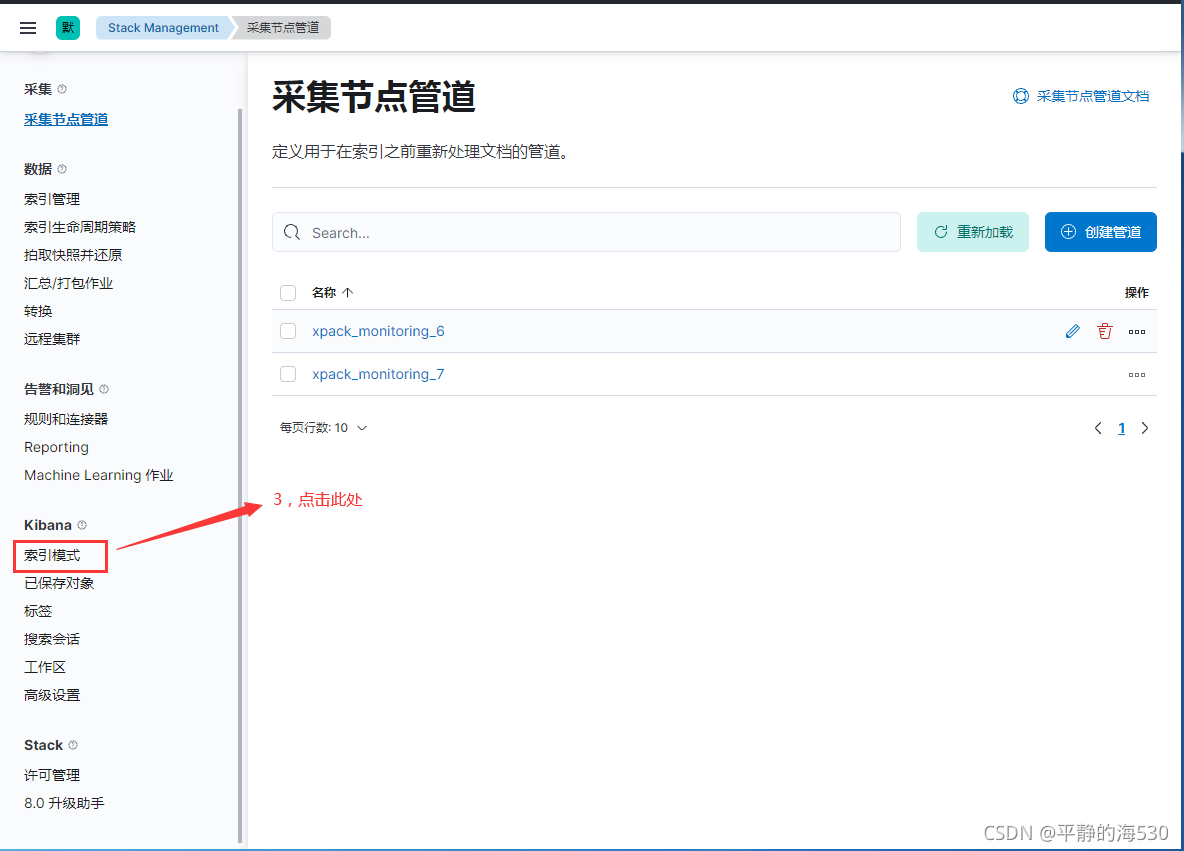
步骤2:
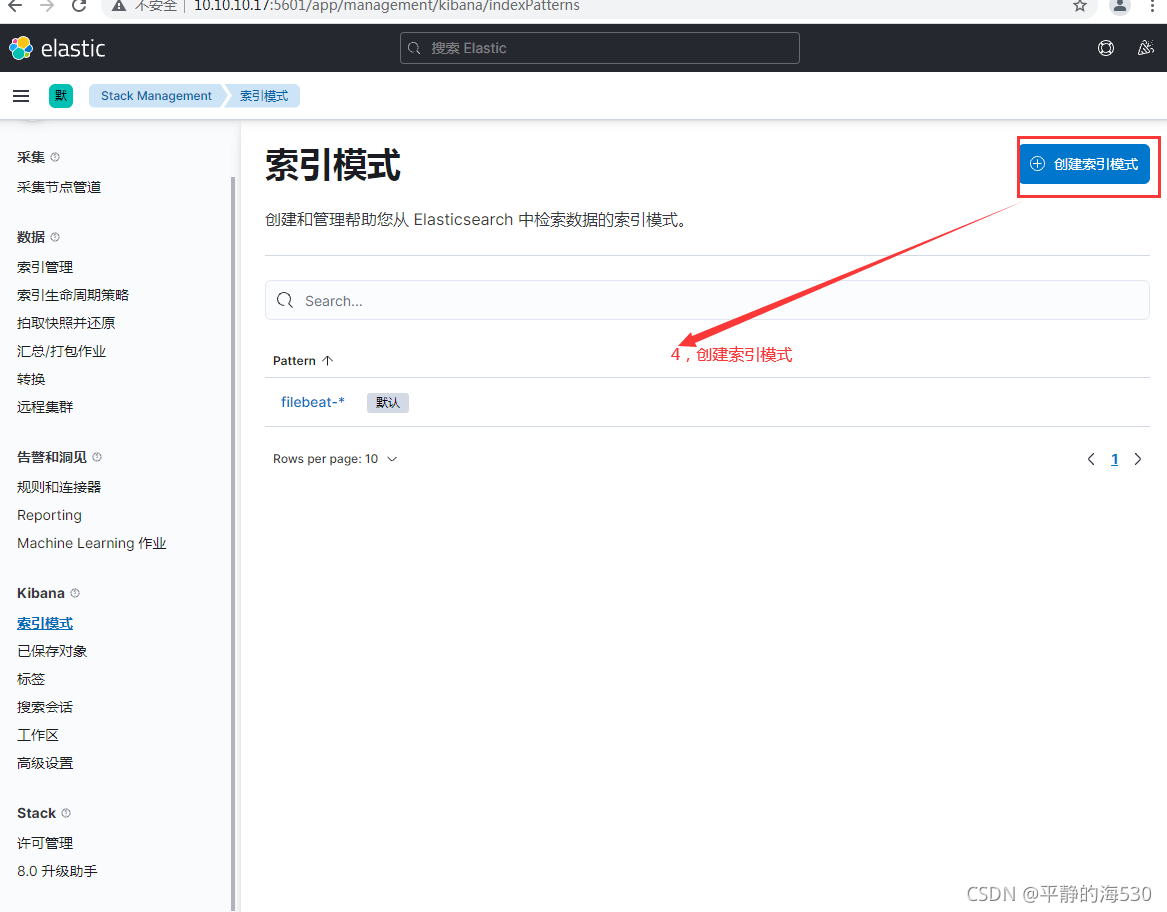
步骤3:
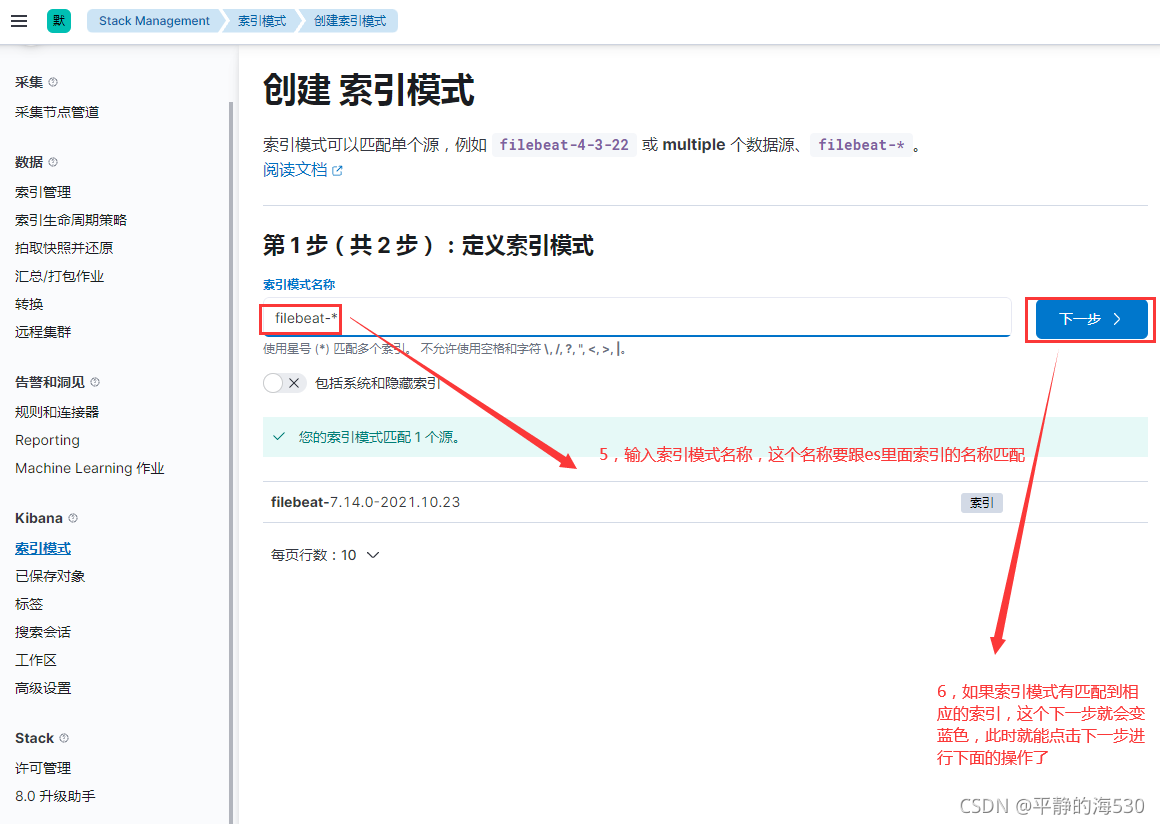
步骤4:
步骤5:
步骤6:
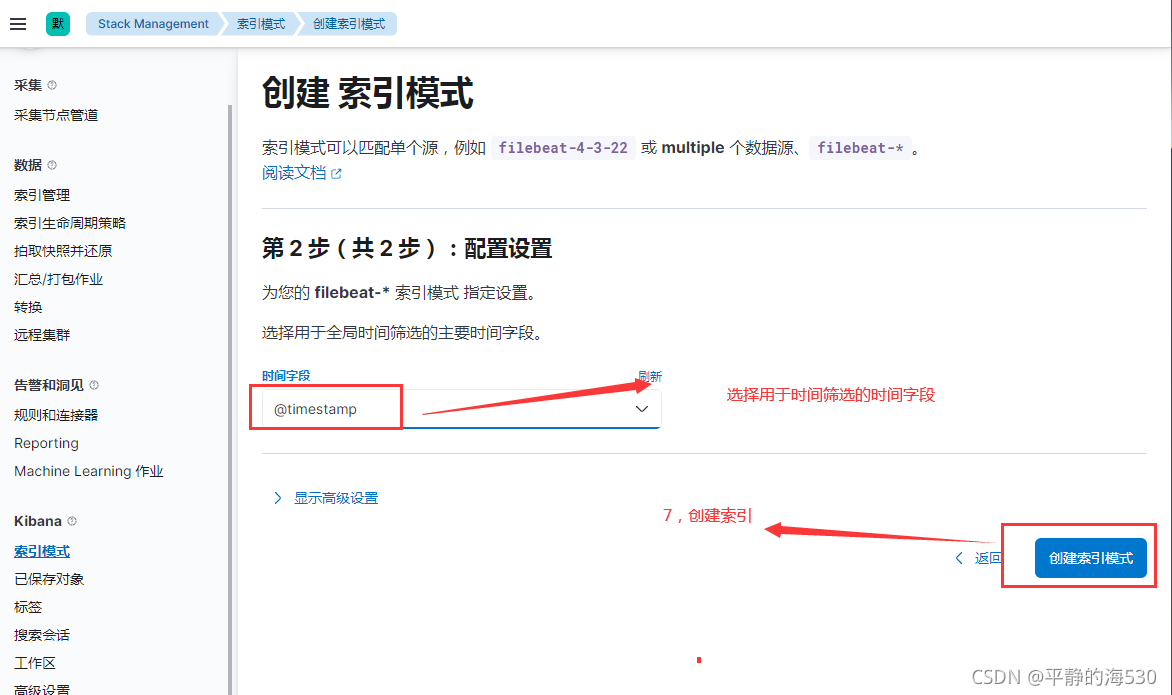
步骤7:
六 ELK综合实践2
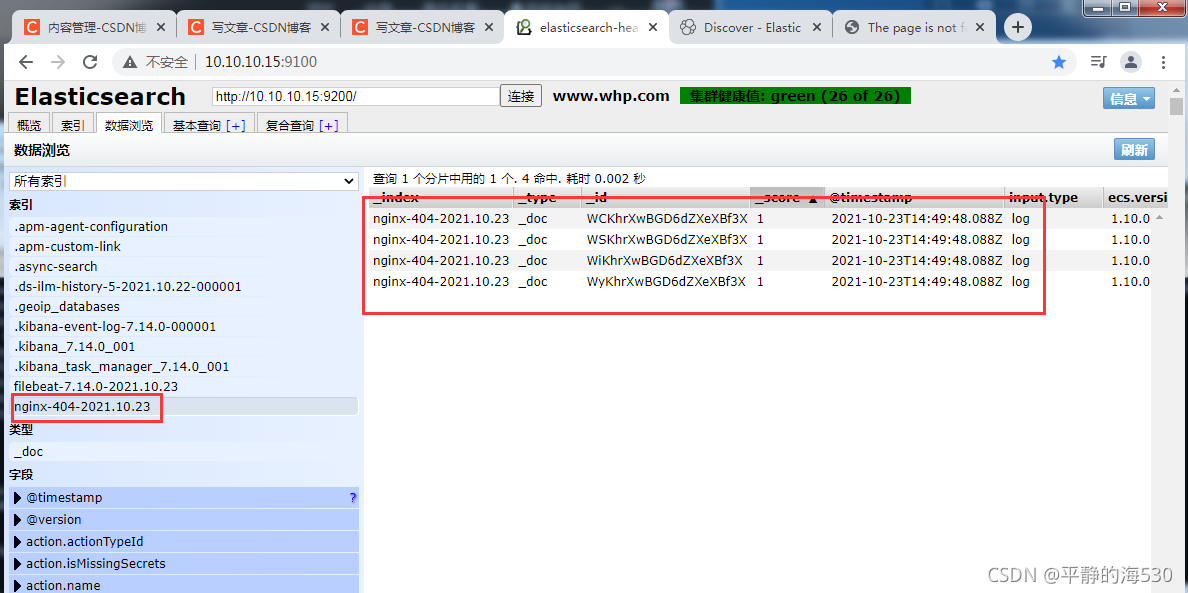
从nginx日志中,获取状态码为404的日志,传输的时候为了显示日志特点,为日志增加一个tag标签,当数据传输到es的时候,定制索引名称
1,修改filebeat配置文件
[root@localhost filebeat]# grep -Env '#|^$' /etc/filebeat/filebeat.yml
1:filebeat.inputs:
2:- type: log
3:  enabled: true
4:  paths:
5:    - /var/log/nginx/access.log
6:  include_lines: ["404"]  # 匹配包含404的行
7:  tags: ["404"]       # 打标签
10:setup.ilm.enabled: false  # 不使用默认的模板
11:setup.template: # 定制模板
12:  name: "nginx"
13:  pattern: "nginx-*"
14:  overwrite: true
17:output.elasticsearch: # 输出到ex
18:  hosts: ["10.10.10.16:9200"]
19:  index: "nginx-404-%{+yyyy.MM.dd}" # 定制索引
2,重启filebeat
3,查看数据
4,配置kibana展示(跟前面所述的步骤一样,这里就不在重复)

7 ELK综合实践3