1,中文:可用性问卷
2,英文原版: sus
Measuring Usability With The System Usability Scale (SUS)
The System Usability Scale (SUS) was originally created as a “quick and dirty” scale for administering after usability tests on systems like VT100 Terminal (“Green-Screen”) applications.
SUS is technology independent and has since been tested on hardware, consumer software, websites, cell-phones, IVRs and even the yellow-pages.
The System Usability Scale
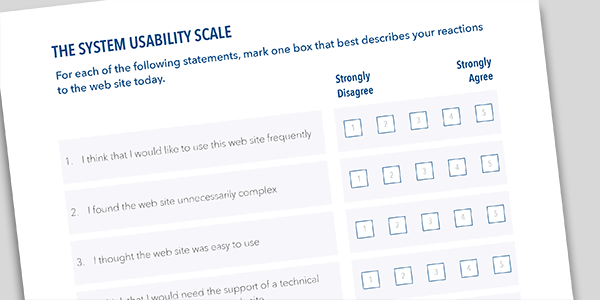
The SUS is a 10 item questionnaire with 5 response options.
- I think that I would like to use this system frequently.
- I found the system unnecessarily complex.
- I thought the system was easy to use.
- I think that I would need the support of a technical person to be able to use this system.
- I found the various functions in this system were well integrated.
- I thought there was too much inconsistency in this system.
- I would imagine that most people would learn to use this system very quickly.
- I found the system very cumbersome to use.
- I felt very confident using the system.
- I needed to learn a lot of things before I could get going with this system.
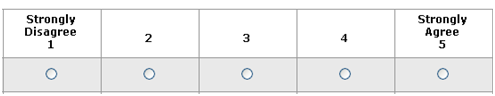
The SUS uses the following response format:
Scoring SUS
- For odd items: subtract one from the user response.
- For even-numbered items: subtract the user responses from 5
- This scales all values from 0 to 4 (with four being the most positive response).
- Add up the converted responses for each user and multiply that total by 2.5. This converts the range of possible values from 0 to 100 instead of from 0 to 40.
Interpreting SUS scores
Despite the wide usage of SUS, there has been little guidance on interpreting SUS scores, acceptable modifications to the items and information on reliability and validity.
Over the years I’ve used SUS a lot in my own research and during usability evaluations. During this time I’ve reviewed the existing research on SUS and analyzed data from over 5000 users across 500 different evaluations.
This data shows that SUS is a reliable and valid measure of perceived usability. It performs as well or better than commercial questionnaires and home-grown internal questionnaires.
I’ve put these findings in a 150 page detailed report which contains valuable insights on background, benchmarks and best practices for anyone using the SUS. Here are a few highlights.
What is a good SUS score?
The average SUS score from all 500 studies is a 68. A SUS score above a 68 would be considered above average and anything below 68 is below average.
The best way to interpret your score is to convert it to a percentile rank through a process called normalizing. I’ve created a calculator and guide which takes raw SUS scores and generates percentile ranks and letter-grades (from A+ to F) for eight different application types.
The graph below shows how the percentile ranks associate with SUS scores and letter grades.
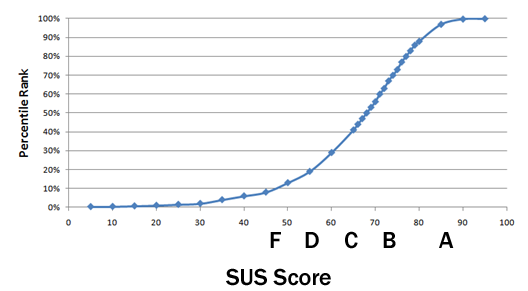
This process is similar to grading on a curve based on the distribution of all scores. For example, a raw SUS score of a 74 converts to a percentile rank of 70%. A SUS score of 74 has higher perceived usability than 70% of all products tested. It can be interpreted as a grade of a B-.
You’d need to score above an 80.3 to get an A (the top 10% of scores). This is also the point where users are more likely to be recommending the product to a friend. Scoring at the mean score of 68 gets you a C and anything below a 51 is an F (putting you in the bottom 15%).
SUS scores are not percentages
Even though a SUS score can range from 0 to 100, it isn’t a percentage. While it is technically correct that a SUS score of 70 out of 100 represents 70% of the possible maximum score, it suggests the score is at the 70th percentile. A score at this level would mean the application tested is above average. In fact, a score of 70 is closer to the average SUS score of 68. It is actually more appropriate to call it 50%.
When communicating SUS scores to stakeholders, and especially those who are unfamiliar with SUS, it’s best to convert the original SUS score into a percentile so a 70% really means above average.
SUS measures usability and learnability
While SUS was only intended to measure perceived ease-of-use (a single dimension), recent researchshows that it provides a global measure of system satisfaction and sub-scales of usability and learnability. Items 4 and 10 provide the learnability dimension and the other 8 items provide the usability dimension. This means you can track and report on both subscales and the global SUS score.
SUS is reliable
Reliability refers to how consistently users respond to the items (the repeatability of the responses). SUS has been shown to be more reliable and detect differences at smaller sample sizes than home-grown questionnaires and other commercially available ones.
Sample size and reliability are unrelated, so SUS can be used on very small sample sizes (as few as two users) and still generate reliable results. However, small sample sizes generate imprecise estimates of the unknown user-population SUS score. You should compute a confidence interval around your sample SUS score to understand the variability in your estimate.
SUS is valid
Validity refers to how well something can measure what it is intended to measure. In this case that’s perceived usability. SUS has been shown to effectively distinguish between unusable and usable systems as well as or better than proprietary questionnaires. SUS also correlates highly with other questionnaire-based measurements of usability (called concurrent validity).
SUS is not diagnostic
SUS was not intended to diagnose usability problems. In its original use, SUS was administered after a usability test where all user-sessions were recorded on videotape (VHS and Betamax). Low SUS scores indicated to the researchers that they needed to review the tape and identify problems encountered with the interface. SUS can be used outside of a usability test for benchmarking, however, the results won’t shed much light on why users are responding the way they are.
There is a modest correlation between SUS and task-performance
Users may encounter problems (even severe problems) with an application and provide SUS scores which seem high. Post-test SUS scores do correlate with task performance, although the correlation is modest (around r= .24 for completion rates and time), which means that only around 6% of the SUS scores are explained by what happens in the usability test. This is the same level of correlation foundwith other post-test questionnaires.
Quick' and not so dirty
At only 10 items, SUS may be quick to administer and score, but data from over 5000 users and almost 500 different studies suggests that SUS is far from dirty. Its versatility, brevity and wide-usage means that despite inevitable changes in technology, we can probably count on SUS being around for at least another 30 years.
Want to dive deeper?
Jeff is presenting a seminar on Measuring the User Experience in London on June 15th 2016. This is a half-day workshop for researchers and designers who want to use numbers to inform design and make better decisions about websites, software or mobile apps. Sign up here.
3 https://www.usability.gov/how-to-and-tools/methods/system-usability-scale.html
Using SUS
The SU scale is generally used after the respondent has had an opportunity to use the
system being evaluated, but before any debriefing or discussion takes place. Respondents
should be asked to record their immediate response to each item, rather than thinking about
items for a long time.
All items should be checked. If a respondent feels that they cannot respond to a particular
item, they should mark the centre point of the scale.
Scoring SUS
SUS yields a single number representing a composite measure of the overall usability of the
system being studied. Note that scores for individual items are not meaningful on their own.
To calculate the SUS score, first sum the score contributions from each item. Each item's
score contribution will range from 0 to 4. For items 1,3,5,7,and 9 the score contribution is the
scale position minus 1. For items 2,4,6,8 and 10, the contribution is 5 minus the scale position.
Multiply the sum of the scores by 2.5 to obtain the overall value of SU.
SUS scores have a range of 0 to 100.
The following section gives an example of a scored SU scale