MATLAB图中图绘制(局部放大图)
方法1 使用magnify工具
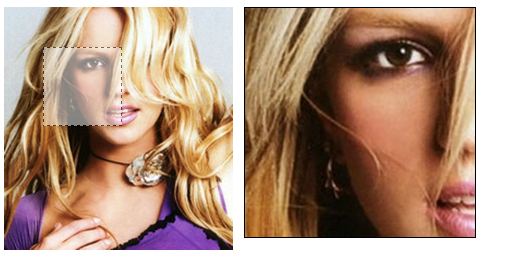
magnify工具可以实现对绘制的figure手动选择区域,并且可以选择多个放大区域。
- 下载
magnify.m,可以点击上面的链接下载或者可以拷贝附件的代码,保存为magnify.m。然后放到工作目录下(也就是和绘图的程序同一目录。) - 绘制一张图figure.
- 保证前两个工作完成,输入magnify,接着就可以选择放大区域了,右键选中想要放大的区域,可以使用‘<’和‘>’缩放方法范围,‘+’和‘-’缩放放大比例,松开右键确认。
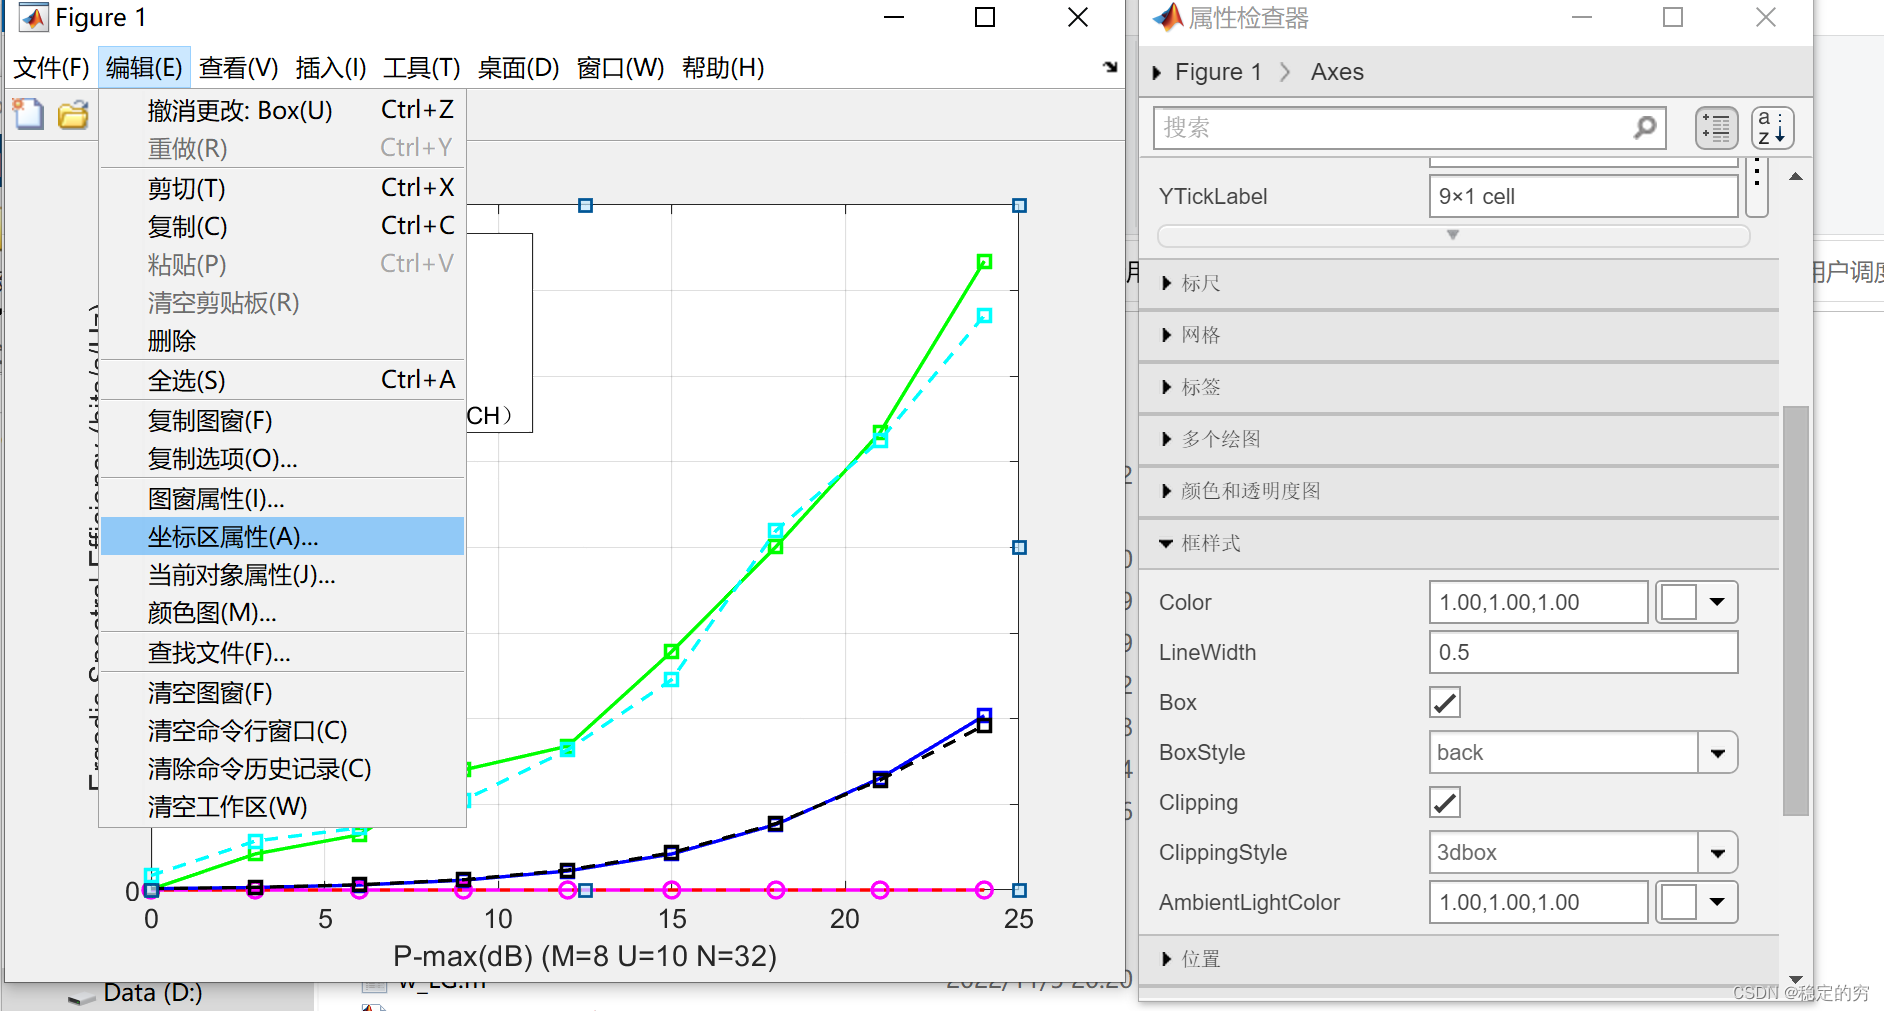
- 可以通过工具->编辑图形调整子图位置等。

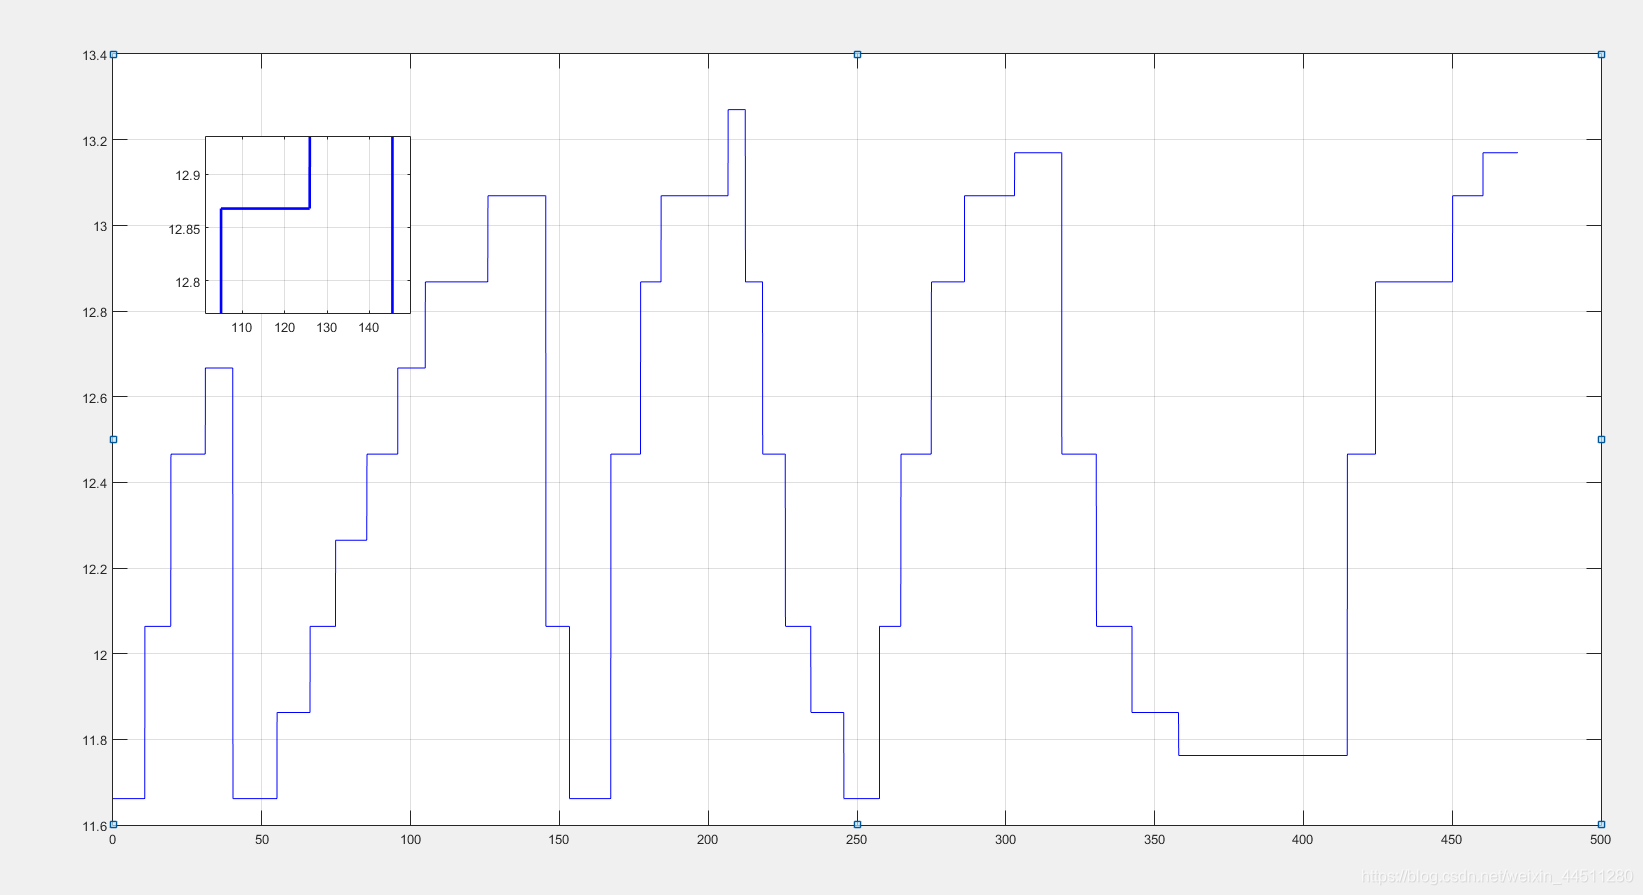
方法2 手动绘制1
此方法需要通过手动设置绘制的数据,具体的说就是需要哪一段就提取某一段的数,通过matlab自带的axes绘制子图。
clc;clear;close all;
t=linspace(0,3,100);
t1=linspace(1,1.2,100);
y=sin(t);
y1=sin(t1);
figure;                                   % 大图
plot(t,y);
axis('equal');
axes('Position',[0.2,0.5,0.3,0.3]);   % 小图 设置小图的大小和位置(左上角位置+宽高)
plot(t1,y1);
xlim([min(t1),max(t1)]);

方法3 手动绘制2
此方法需要通过手动设置绘制的数据,与第二种不同的是,该方法直接绘制所有数据,但是只显示需要放大的区域。
clc;clear;close all;
t=linspace(0,3,100);
y=sin(t);
figure;                                   % 大图
plot(t,y);
axis('equal');
axes('Position',[0.2,0.5,0.3,0.3]);   % 小图 设置小图的大小和位置(左上角位置+宽高)
plot(t,y);
xlim([1,1.2]);

附件 magnify.m(来源于matlab官网)
function magnify(f1)
%
%magnify(f1)
%
%  Figure creates a magnification box when under the mouse
%  position when a button is pressed.  Press '+'/'-' while
%  button pressed to increase/decrease magnification. Press
%  '>'/'<' while button pressed to increase/decrease box size.
%  Hold 'Ctrl' while clicking to leave magnification on figure.
%
%  Example:
%     plot(1:100,randn(1,100),(1:300)/3,rand(1,300)), grid on,
%     magnify;% Rick Hindman - 7/29/04if (nargin == 0), f1 = gcf; end;
set(f1, ...'WindowButtonDownFcn',  @ButtonDownCallback, ...'WindowButtonUpFcn', @ButtonUpCallback, ...'WindowButtonMotionFcn', @ButtonMotionCallback, ...'KeyPressFcn', @KeyPressCallback);
return;function ButtonDownCallback(src,eventdata)f1 = src;a1 = get(f1,'CurrentAxes');a2 = copyobj(a1,f1);set(f1, ...'UserData',[f1,a1,a2], ...'Pointer','fullcrosshair', ...'CurrentAxes',a2);set(a2, ...'UserData',[2,0.2], ...  %magnification, frame size'Color',get(a1,'Color'), ...'Box','on');xlabel(''); ylabel(''); zlabel(''); title('');set(get(a2,'Children'), ...'LineWidth', 2);set(a1, ...'Color',get(a1,'Color')*0.95);set(f1, ...'CurrentAxes',a1);ButtonMotionCallback(src);
return;function ButtonUpCallback(src,eventdata)H = get(src,'UserData');f1 = H(1); a1 = H(2); a2 = H(3);set(a1, ...'Color',get(a2,'Color'));set(f1, ...'UserData',[], ...'Pointer','arrow', ...'CurrentAxes',a1);if ~strcmp(get(f1,'SelectionType'),'alt'),delete(a2);end;
return;function ButtonMotionCallback(src,eventdata)H = get(src,'UserData');if ~isempty(H)f1 = H(1); a1 = H(2); a2 = H(3);a2_param = get(a2,'UserData');f_pos = get(f1,'Position');a1_pos = get(a1,'Position');[f_cp, a1_cp] = pointer2d(f1,a1);set(a2,'Position',[(f_cp./f_pos(3:4)) 0 0]+a2_param(2)*a1_pos(3)*[-1 -1 2 2]);a2_pos = get(a2,'Position');set(a2,'XLim',a1_cp(1)+(1/a2_param(1))*(a2_pos(3)/a1_pos(3))*diff(get(a1,'XLim'))*[-0.5 0.5]);set(a2,'YLim',a1_cp(2)+(1/a2_param(1))*(a2_pos(4)/a1_pos(4))*diff(get(a1,'YLim'))*[-0.5 0.5]);end;
return;function KeyPressCallback(src,eventdata)H = get(gcf,'UserData');if ~isempty(H)f1 = H(1); a1 = H(2); a2 = H(3);a2_param = get(a2,'UserData');if (strcmp(get(f1,'CurrentCharacter'),'+') | strcmp(get(f1,'CurrentCharacter'),'='))a2_param(1) = a2_param(1)*1.2;elseif (strcmp(get(f1,'CurrentCharacter'),'-') | strcmp(get(f1,'CurrentCharacter'),'_'))a2_param(1) = a2_param(1)/1.2;elseif (strcmp(get(f1,'CurrentCharacter'),'<') | strcmp(get(f1,'CurrentCharacter'),','))a2_param(2) = a2_param(2)/1.2;elseif (strcmp(get(f1,'CurrentCharacter'),'>') | strcmp(get(f1,'CurrentCharacter'),'.'))a2_param(2) = a2_param(2)*1.2;end;set(a2,'UserData',a2_param);ButtonMotionCallback(src);end;
return;% Included for completeness (usually in own file)
function [fig_pointer_pos, axes_pointer_val] = pointer2d(fig_hndl,axes_hndl)
%
%pointer2d(fig_hndl,axes_hndl)
%
%	Returns the coordinates of the pointer (in pixels)
%	in the desired figure (fig_hndl) and the coordinates
%       in the desired axis (axes coordinates)
%
% Example:
%  figure(1),
%  hold on,
%  for i = 1:1000,
%     [figp,axp]=pointer2d;
%     plot(axp(1),axp(2),'.','EraseMode','none');
%     drawnow;
%  end;
%  hold off% Rick Hindman - 4/18/01if (nargin == 0), fig_hndl = gcf; axes_hndl = gca; end;
if (nargin == 1), axes_hndl = get(fig_hndl,'CurrentAxes'); end;set(fig_hndl,'Units','pixels');pointer_pos = get(0,'PointerLocation');	%pixels {0,0} lower left
fig_pos = get(fig_hndl,'Position');	%pixels {l,b,w,h}fig_pointer_pos = pointer_pos - fig_pos([1,2]);
set(fig_hndl,'CurrentPoint',fig_pointer_pos);if (isempty(axes_hndl)),axes_pointer_val = [];
elseif (nargout == 2),axes_pointer_line = get(axes_hndl,'CurrentPoint');axes_pointer_val = sum(axes_pointer_line)/2;
end;