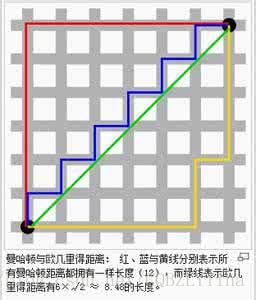
欧氏距离定义: 欧氏距离( Euclidean distance)是一个通常采用的距离定义,它是在m维空间中两个点之间的真实距离。
在二维和三维空间中的欧式距离的就是两点之间的距离,二维的公式是:
begin{equation} d = sqrt{(X_1 – Y_1)^2 + (X_2 – Y_2)^2}end{equation}
三维的公式是:
begin{equation} d = sqrt{(X_1 – Y_1)^2 + (X_2 – Y_2)^2 + (X_3 – Y_3)^2}end{equation}
推广到n维空间,欧式距离的公式是:
begin{equation} d = sqrt{(X_1 – Y_1)^2 + (X_2 – Y_2)^2 + (X_3 – Y_3)^2 + … (X_d – Y_d)}end{equation}
求3维两点距离:
| 1 2 3 4 5 6 7 8 9 10 11 12 13 14 15 16 17 18 19 20 21 22 23 24 25 26 27 28 29 30 31 32 | import numpy as np from matplotlib import pyplot as plt from mpl_toolkits.mplot3d import Axes3D from mpl_toolkits.mplot3d import proj3d
coords1 = [1, 2, 3] coords2 = [4, 5, 6]
fig = plt.figure(figsize=(7,7)) ax = fig.add_subplot(111, projection='3d')
ax.scatter((coords1[0], coords2[0]), (coords1[1], coords2[1]), (coords1[2], coords2[2]), color="k", s=150)
ax.plot((coords1[0], coords2[0]), (coords1[1], coords2[1]), (coords1[2], coords2[2]), color="r")
ax.set_xlabel('X') ax.set_ylabel('Y') ax.set_zlabel('Z')
ax.text(x=2.5, y=3.5, z=4.0, s='d = 5.19')
plt.title('Euclidean distance between 2 3D-coordinates')
plt.show() |

经典Python实现 (vs) NumPy实现
| 1 2 3 4 5 | # 样本数据 coords1 = [1, 2, 3] coords2 = [4, 5, 6] np_c1 = np.array(coords1) np_c2 = np.array(coords2) |
| 1 2 3 4 5 6 7 8 | # 经典 For循环
def eucldist_forloop(coords1, coords2): """ Calculates the euclidean distance between 2 lists of coordinates. """ dist = 0 for (x, y) in zip(coords1, coords2): dist += (x - y)**2 return dist**0.5 |
| 1 2 3 4 5 | # 生成器表达式
def eucldist_generator(coords1, coords2): """ Calculates the euclidean distance between 2 lists of coordinates. """ return sum((x - y)**2 for x, y in zip(coords1, coords2))**0.5 |
| 1 2 3 4 5 | # NumPy版本
def eucldist_vectorized(coords1, coords2): """ Calculates the euclidean distance between 2 lists of coordinates. """ return np.sqrt(np.sum((coords1 - coords2)**2)) |
| 1 2 3 | # NumPy 内建函数
np.linalg.norm(np_c1 - np_c2) |
| 1 2 3 4 | print(eucldist_forloop(coords1, coords2)) print(eucldist_generator(coords1, coords2)) print(eucldist_vectorized(np_c1, np_c2)) print(np.linalg.norm(np_c1 - np_c2)) |

timeit比较执行效率:
| 1 2 3 4 5 6 7 8 9 10 11 12 13 14 15 16 17 18 19 20 21 22 23 24 25 26 27 28 29 30 31 32 33 34 35 36 37 38 39 40 41 42 43 44 45 46 47 48 49 50 51 52 53 54 55 56 57 58 59 60 61 62 63 64 65 66 67 68 69 70 71 72 73 74 75 76 77 78 79 80 81 82 83 84 85 86 87 88 89 | import numpy as np from matplotlib import pyplot as plt from mpl_toolkits.mplot3d import Axes3D from mpl_toolkits.mplot3d import proj3d
coords1 = [1, 2, 3] coords2 = [4, 5, 6] np_c1 = np.array(coords1) np_c2 = np.array(coords2)
def eucldist_forloop(coords1, coords2): """ Calculates the euclidean distance between 2 lists of coordinates. """ dist = 0 for (x, y) in zip(coords1, coords2): dist += (x - y)**2 return dist**0.5
def eucldist_generator(coords1, coords2): """ Calculates the euclidean distance between 2 lists of coordinates. """ return sum((x - y)**2 for x, y in zip(coords1, coords2))**0.5
def eucldist_vectorized(coords1, coords2): """ Calculates the euclidean distance between 2 lists of coordinates. """ return np.sqrt(np.sum((coords1 - coords2)**2))
import timeit import random random.seed(123)
from numpy.linalg import norm as np_linalg_norm
funcs = ('eucldist_forloop', 'eucldist_generator', 'eucldist_vectorized', 'np_linalg_norm') times = {f:[] for f in funcs} orders_n = [10**i for i in range(1, 8)] for n in orders_n:
c1 = [random.randint(0,100) for _ in range(n)] c2 = [random.randint(0,100) for _ in range(n)] np_c1 = np.array(c1) np_c2 = np.array(c2)
assert(eucldist_forloop(c1, c2) == eucldist_generator(c1, c2) == eucldist_vectorized(np_c1, np_c2) == np_linalg_norm(np_c1 - np_c2) )
times['eucldist_forloop'].append(min(timeit.Timer('eucldist_forloop(c1, c2)', 'from __main__ import c1, c2, eucldist_forloop').repeat(repeat=50, number=1))) times['eucldist_generator'].append(min(timeit.Timer('eucldist_generator(c1, c2)', 'from __main__ import c1, c2, eucldist_generator').repeat(repeat=50, number=1))) times['eucldist_vectorized'].append(min(timeit.Timer('eucldist_vectorized(np_c1, np_c2)', 'from __main__ import np_c1, np_c2, eucldist_vectorized').repeat(repeat=50, number=1))) times['np_linalg_norm'].append(min(timeit.Timer('np_linalg_norm(np_c1 - np_c2)', 'from __main__ import np_c1, np_c2, np_linalg_norm').repeat(repeat=50, number=1)))
labels = {'eucldist_forloop': 'for-loop', 'eucldist_generator': 'generator expression (comprehension equiv.)', 'eucldist_vectorized': 'NumPy vectorization', 'np_linalg_norm': 'numpy.linalg.norm' }
def plot(times, orders_n, labels):
colors = ('cyan', '#7DE786', 'black', 'blue') linestyles = ('-', '-', '--', '--') fig = plt.figure(figsize=(11,10)) for lb,c,l in zip(labels.keys(), colors, linestyles): plt.plot(orders_n, times[lb], alpha=1, label=labels[lb], lw=3, color=c, linestyle=l) plt.xlabel('sample size n (items in the list)', fontsize=14) plt.ylabel('time per computation in seconds', fontsize=14) plt.xlim([min(orders_n) / 10, max(orders_n)* 10]) plt.legend(loc=2, fontsize=14) plt.grid() plt.xticks(fontsize=16) plt.yticks(fontsize=16) plt.xscale('log') plt.yscale('log') plt.title('Python for-loop/generator expr. vs. NumPy vectorized code', fontsize=18) plt.show()
plot(times, orders_n, labels) |

文章转载自: http://blog.topspeedsnail.com/archives/954